Picture courtesy of TAP
5 Sustainability
Reducing CO2 emissions and thereby their significant contribution to the greenhouse effect and global warming is considered as high priority in the EU.
Together with other ways to reduce the carbon dioxide emitted from the energy sector, hydrogen is a promising clean form of fuel that only produces water vapor when burned and does not release GHG emissions such as CO2, or air pollutants such as NOx, SO2 and particulate matter. In addition, hydrogen can be produced also from (bio)-methane coupled with CCS and renewable energy sources such as solar and wind energy, making it a sustainable energy source.
To guide the energy transition, initial steps should promote hydrogen by establishing a favorable market environment, encouraging research and innovation and establishing viable transport and distribution networks.
Both Distributed Energy and Global Ambition scenarios show how under normal conditions, without any supply disruption cases, the H2 Infrastructure Level 2 achieves higher CO2 savings compared to H2 Infrastructure Level 1.
The total CO2 emissions are thereby calculated by applying an assumed specific emission factor1 to the consumed hydrogen, or the produced hydrogen from SMR with CCS, as well as to the consumed natural gas (except for national production of biomethane and synthetic methane based on power-to-gas). The fact that hydrogen demand is curtailed to a considerable extent, especially for H2 Infrastructure Level 1, causes some uncertainty over the total emissions calculation. In H2 Infrastructure Level 2, the missing hydrogen is produced using methane, to the extent possible, on top of the potential maximum SMR defined by the scenarios.
However, also other fuel-switches are thinkable, resulting in different emission factors and thus different total emissions. In the following graphs, the curtailed demands for hydrogen and methane per year, per scenario, and per infrastructure level combination are provided. To make the results between the infrastructure levels comparable for this exercise and not to reward demand curtailments by attributing them with 0 emissions, the curtailed H2 demand is multiplied by the emission factor for SMR with CCS and the curtailed CH4 demand is multiplied by the emission factor of natural gas. Thus, the difference in emissions displayed in the graphs is solely linked to the ability of the different infrastructure levels to use electrolytic hydrogen produced from non-CO2-emitting sources instead of hydrogen from SMR with CCS. If the curtailed hydrogen demand had been assumed to be substituted by other sources, e. g., by non-abated SMR, or simply had remained in the methane market, the resulting emissions would be much higher.
All graphs displayed in this chapter show combined CO2 emissions from methane and hydrogen for the Reference case.
1 The emission factors are stated in the Scenario Building Guidelines on pages 25 and 26
5.1 2030 Yearly CO2 Emissions
H2 Infrastructure Level 1 results show that the United Kingdom, Ireland, Luxembourg, Slovenia, Serbia and Cyprus face demand curtailment, without these curtailment higher CO2 emissions would be expected for both Distributed Energy and Global Ambition.
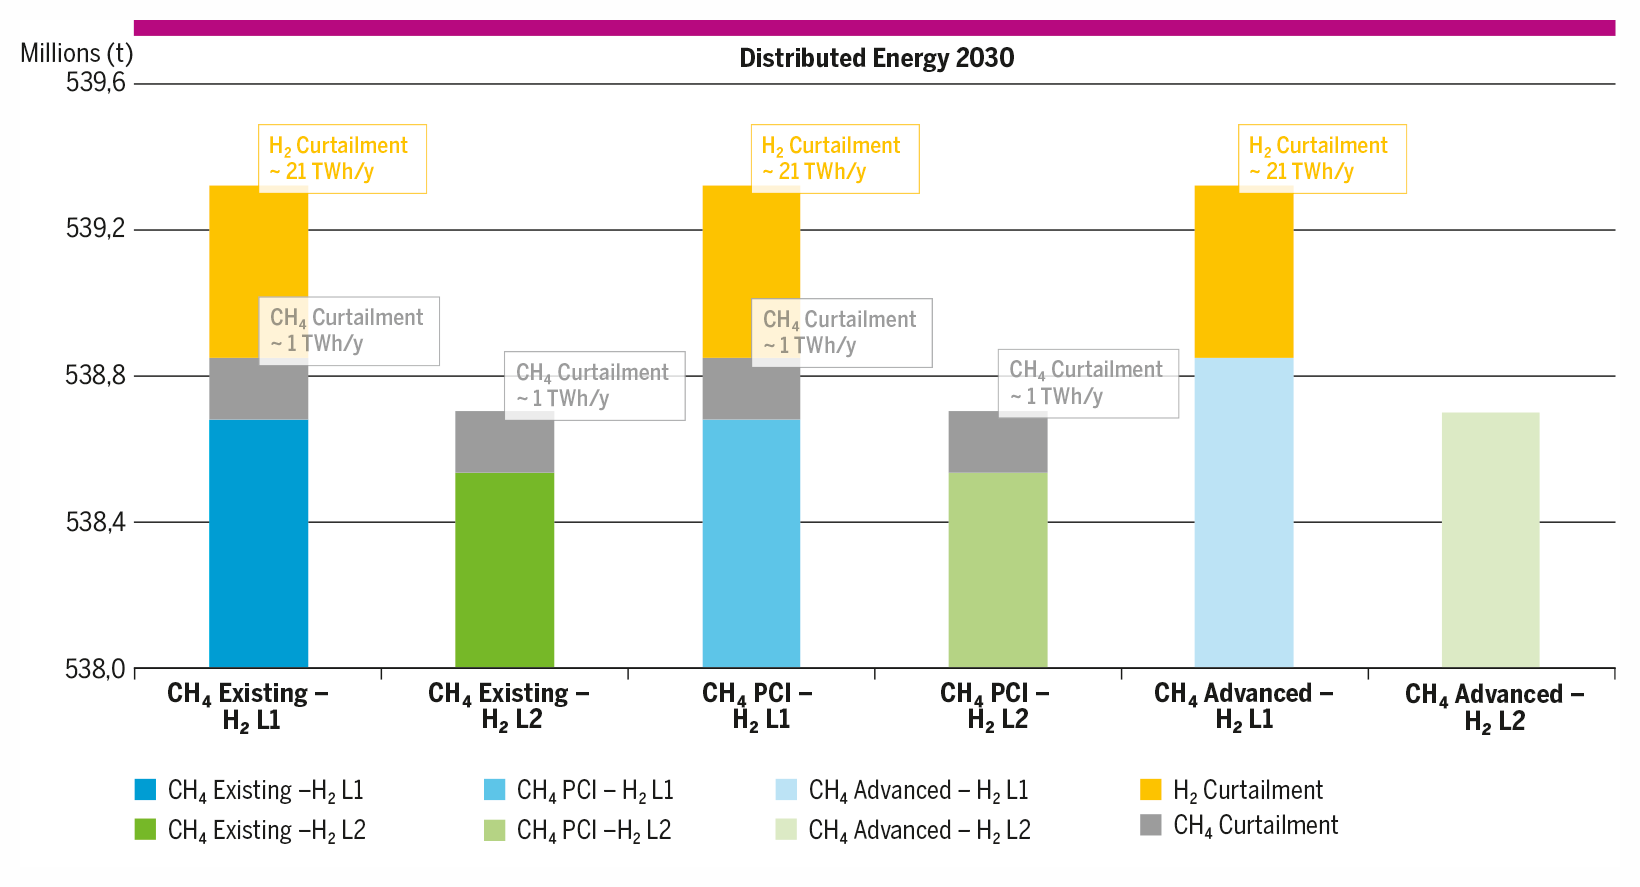
Figure 5.1: CO2 emissions H2 Levels 1 and 2 in 2030 Distributed Energy (million tons / year) combined CH4 & H2
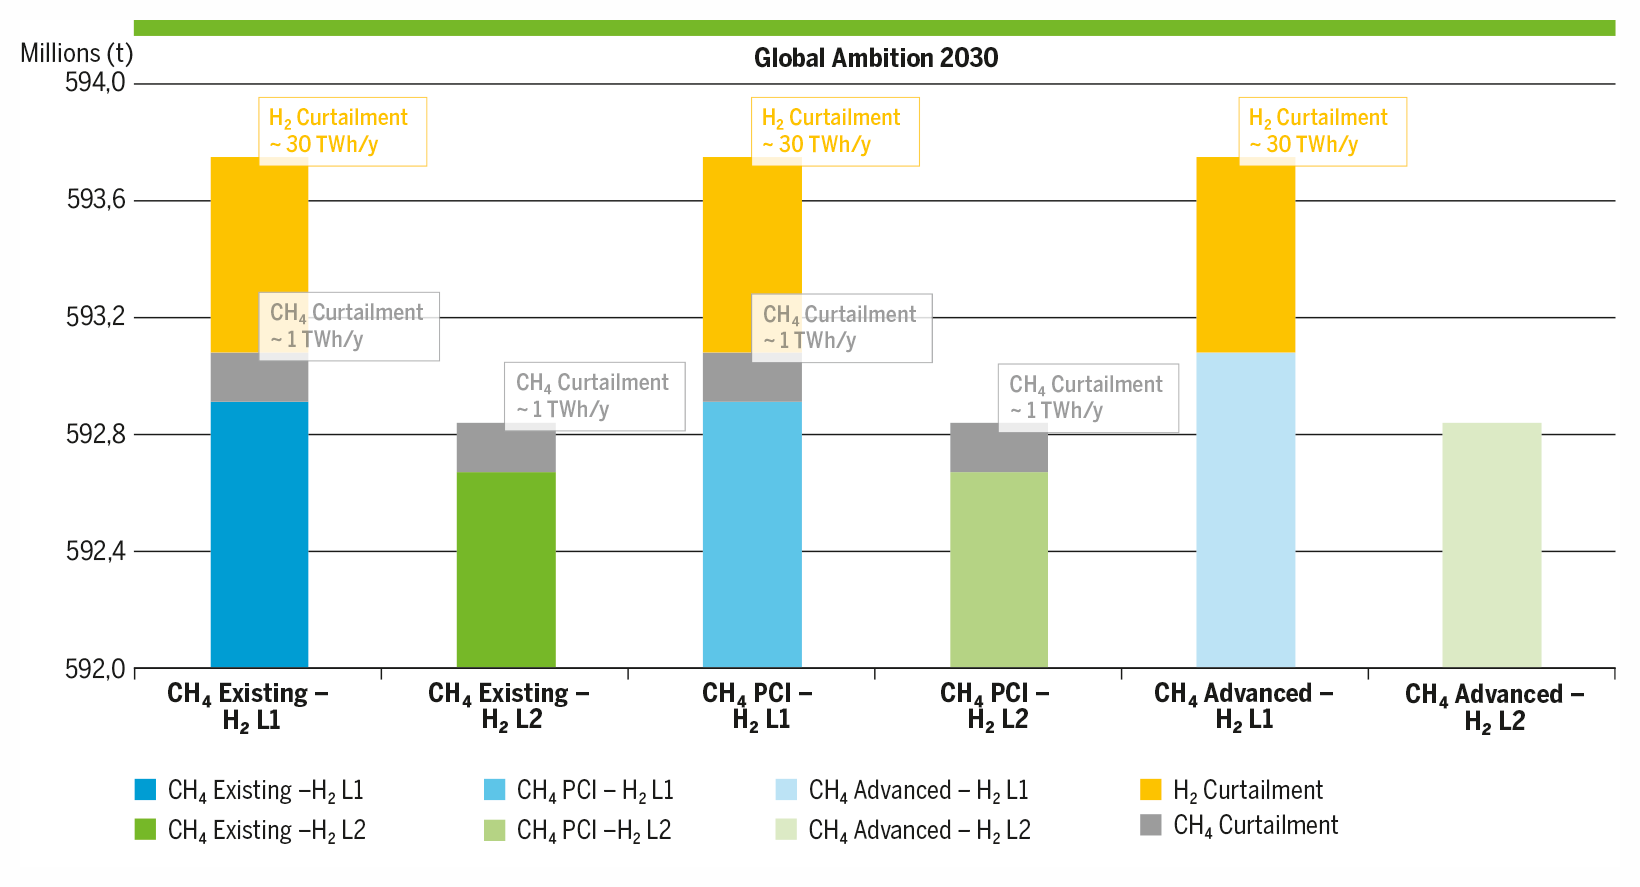
Figure 5.2: CO2 emissions H2 Levels 1 and 2 in 2030 Global Ambition (million tons / year) combined CH4 & H2
5.2 2040 Yearly CO2 Emissions
H2 Infrastructure Level 1 results show a slight demand curtailment in all Europe for Distributed Energy and a higher one, above 10 %, for Global Ambition. Without this demand curtailment higher CO2 emissions would be expected for both scenarios.
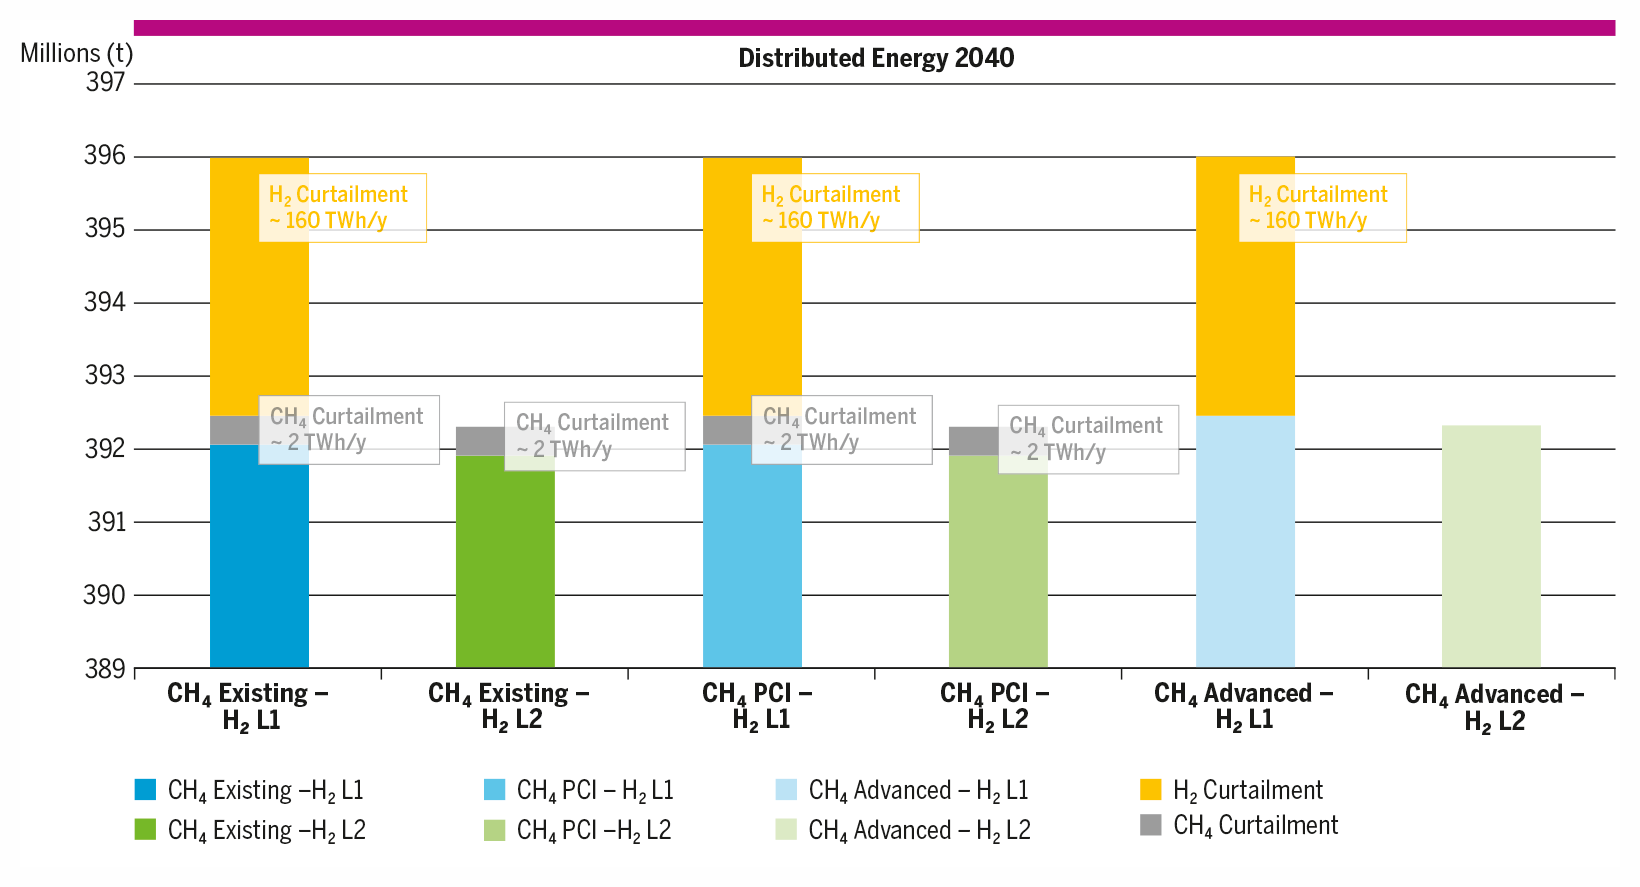
Figure 5.3: CO2 emissions H2 Levels 1 and 2 in 2040 Distributed Energy (million tons / year) combined CH4 & H2
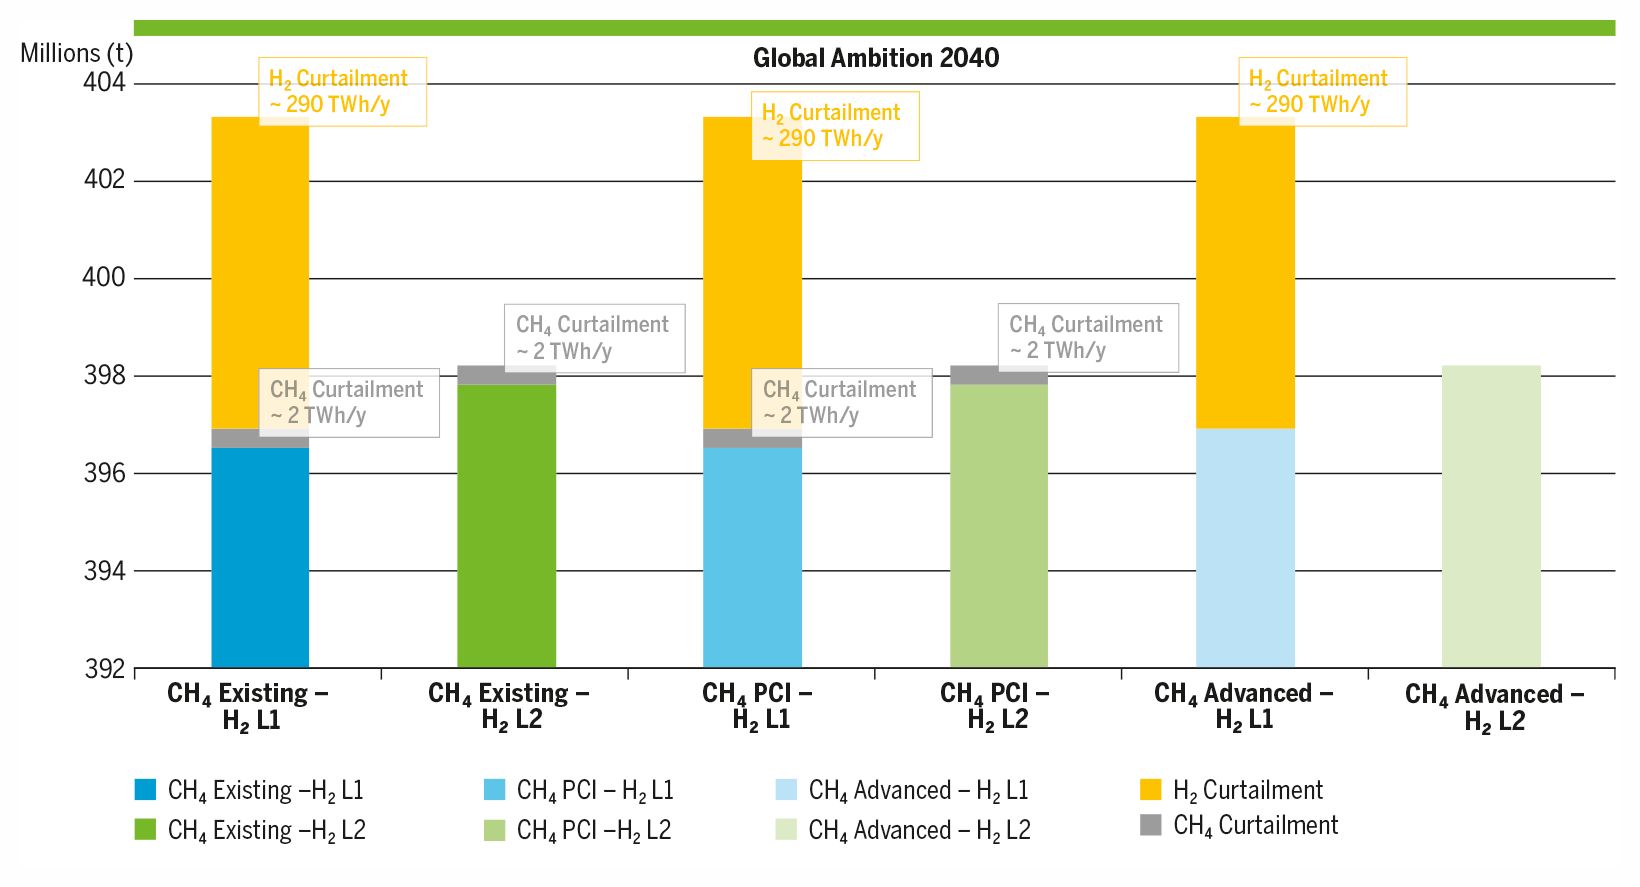
Figure 5.4: CO2 emissions H2 Levels 1 and 2 in 2040 Global Ambition (million tons / year) combined CH4 & H2
5.3 2050 Yearly CO2 Emissions
H2 Level 1 results show a slight demand curtailment in all Europe for Distributed Energy, above 10 %, and a higher one for Global Ambition, above 20 %. Without these demand curtailments higher CO2 emissions would be expected for both scenarios in 2050.
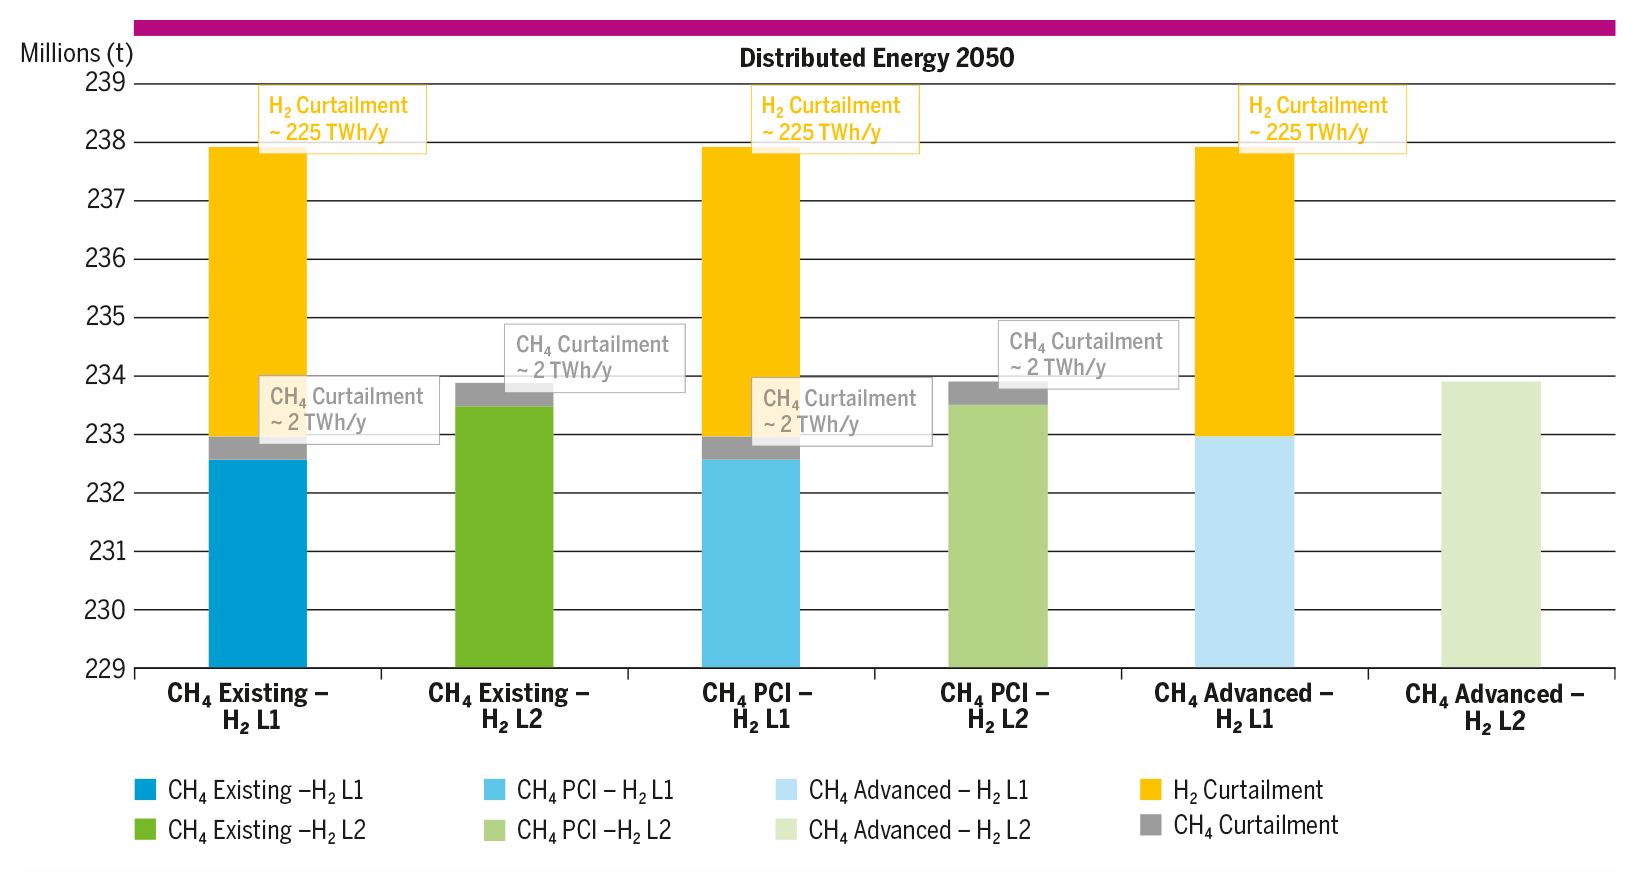
Figure 5.5: CO2 emissions H2 Levels 1 and 2 in 2050 Distributed Energy (million tons / year) combined CH4 & H2
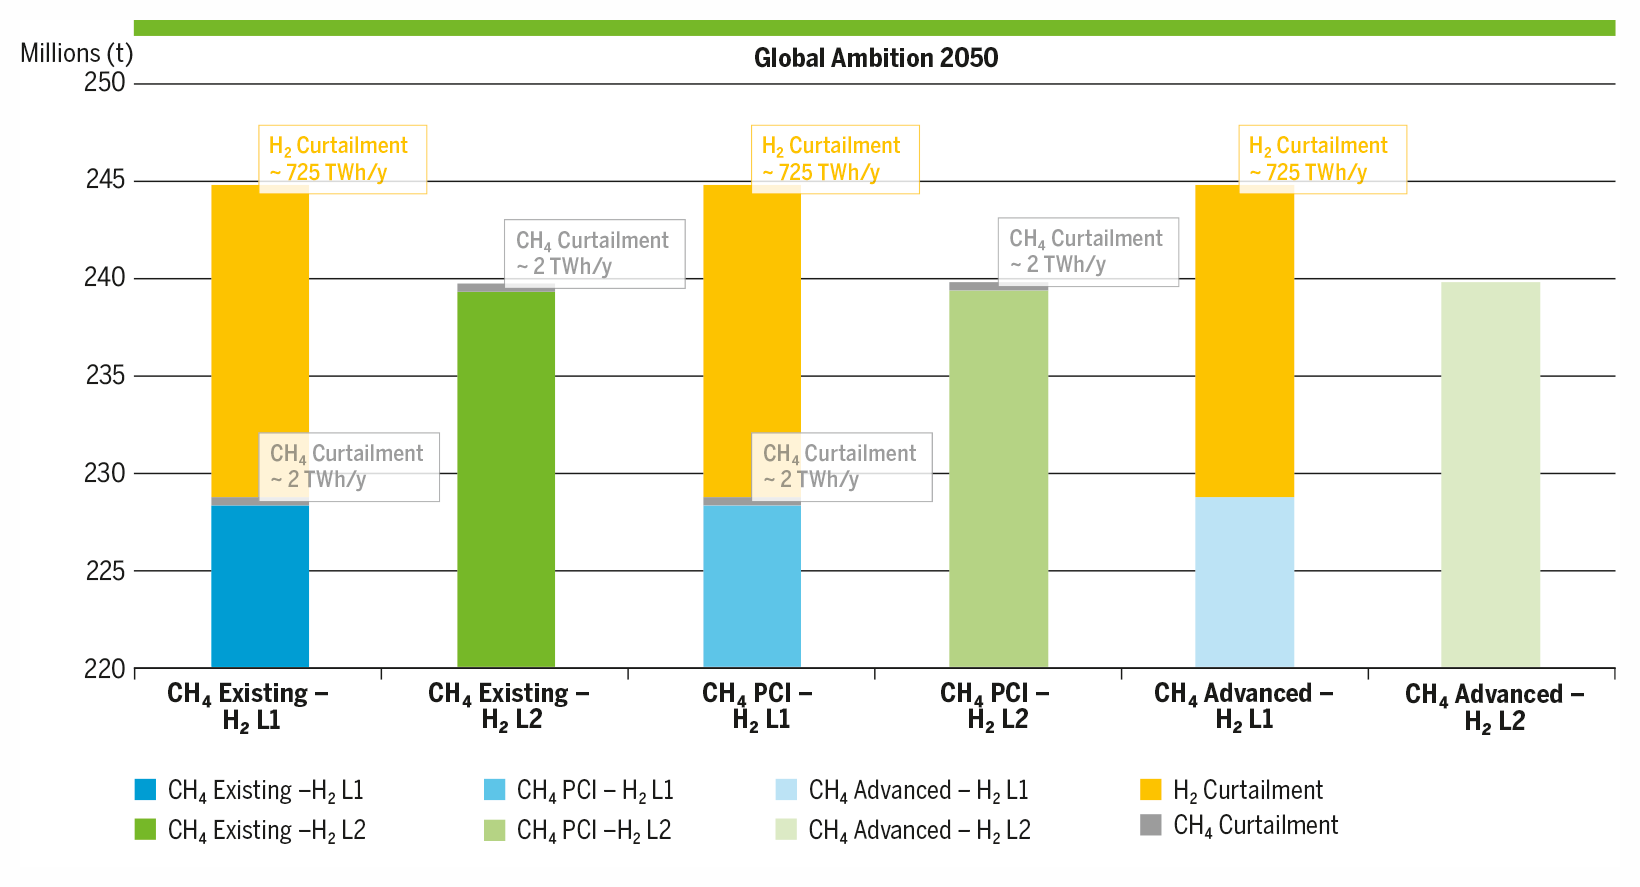
Figure 5.6: CO2 emissions H2 Levels 1 and 2 in 2050 Global Ambition (million tons / year) combined CH4 & H2