3.1 A sustainability-oriented TYNDP
TYNDP 2022 scenarios support the European climate ambitions
The TYNDP 2022 assesses the European infrastructure gaps against sustainability-oriented scenarios, considering either national policies as defined by the Member States’ National Energy and Climate Policies (NECPs , national long-term strategies, hydrogen strategies, etc.) or the objectives as defined in the Paris agreement (COP 21). All scenarios therefore comply with European and national ambitions as displayed in Figure 1.
Furthermore, building on the ever-improving interlinked model developed jointly by ENTSO-E and ENTSOG, the COP 21 scenarios – Distributed Energy and Global Ambition – utilise new sector-coupling methodologies and dedicated modelling tools to optimise overall system efficiencies and flexibility as well as to better capture the interactions and new dynamics at the interfaces between various end-use sectors, at various geographical scales and with other carriers (Power-to-Gas and Power-to-liquid).
TYNDP 2022 for the first time builds scenarios modelled hydrogen systems and electrolysis at pan-European scale.
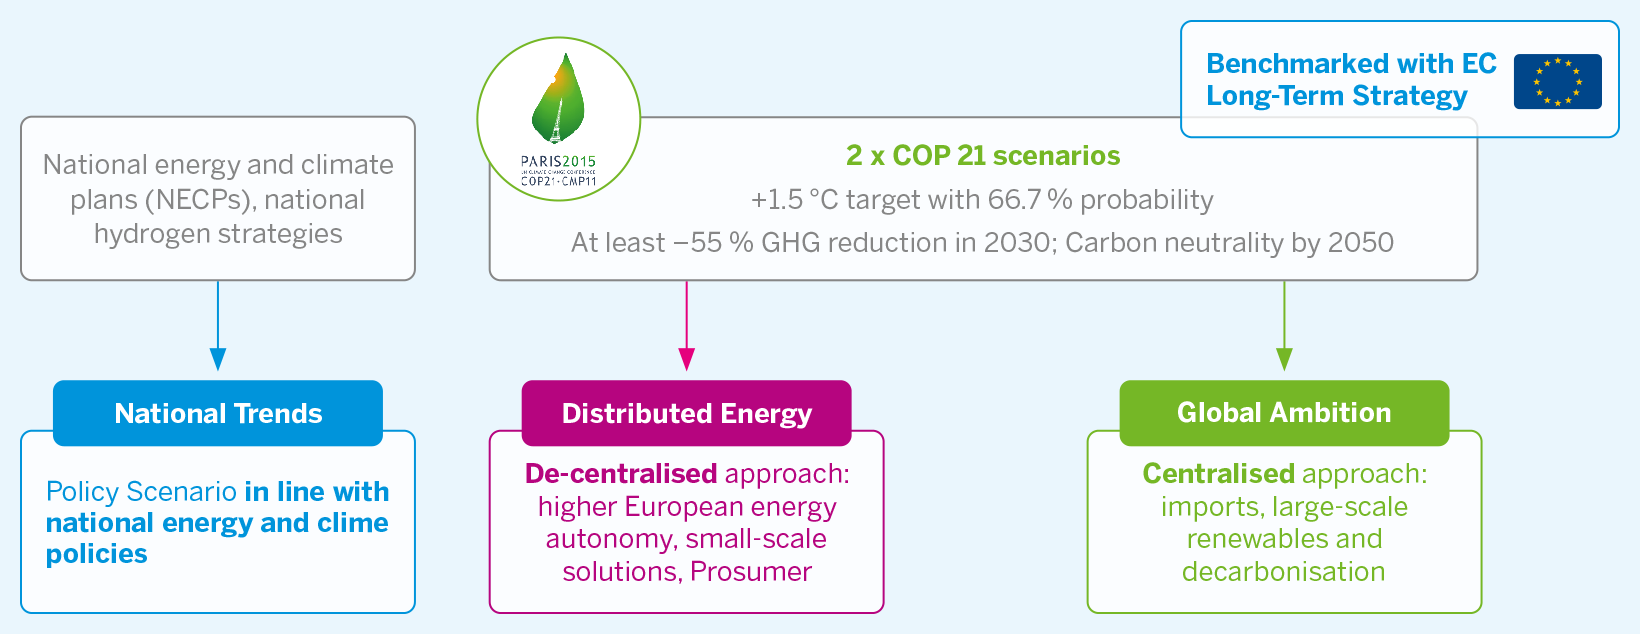
Figure 3.1: TYNDP 2022 scenarios: storylines
3.2 COP 21 scenarios meet the 2030 targets
and reach carbon neutrality by 2050
The TYNDP 2022 assessment reflects the infrastructure needs to reach a net-zero energy system in Europe by 2050. Both Distributed Energy and Global Ambition foresee a reduction of GHG emissions of at least 55 percent by 2030 compared to the 1990 level. Distributed Energy reaches carbon neutrality by 20502 and Global Ambition already achieves carbon neutrality around 2045.
2 Carbon neutrality (or net zero) means having a balance between emitting carbon and absorbing carbon from the atmosphere in carbon sinks. Removing carbon oxide from the atmosphere and then storing it is known as carbon sequestration, for example through land use, land use change and forestry (LULUCF).
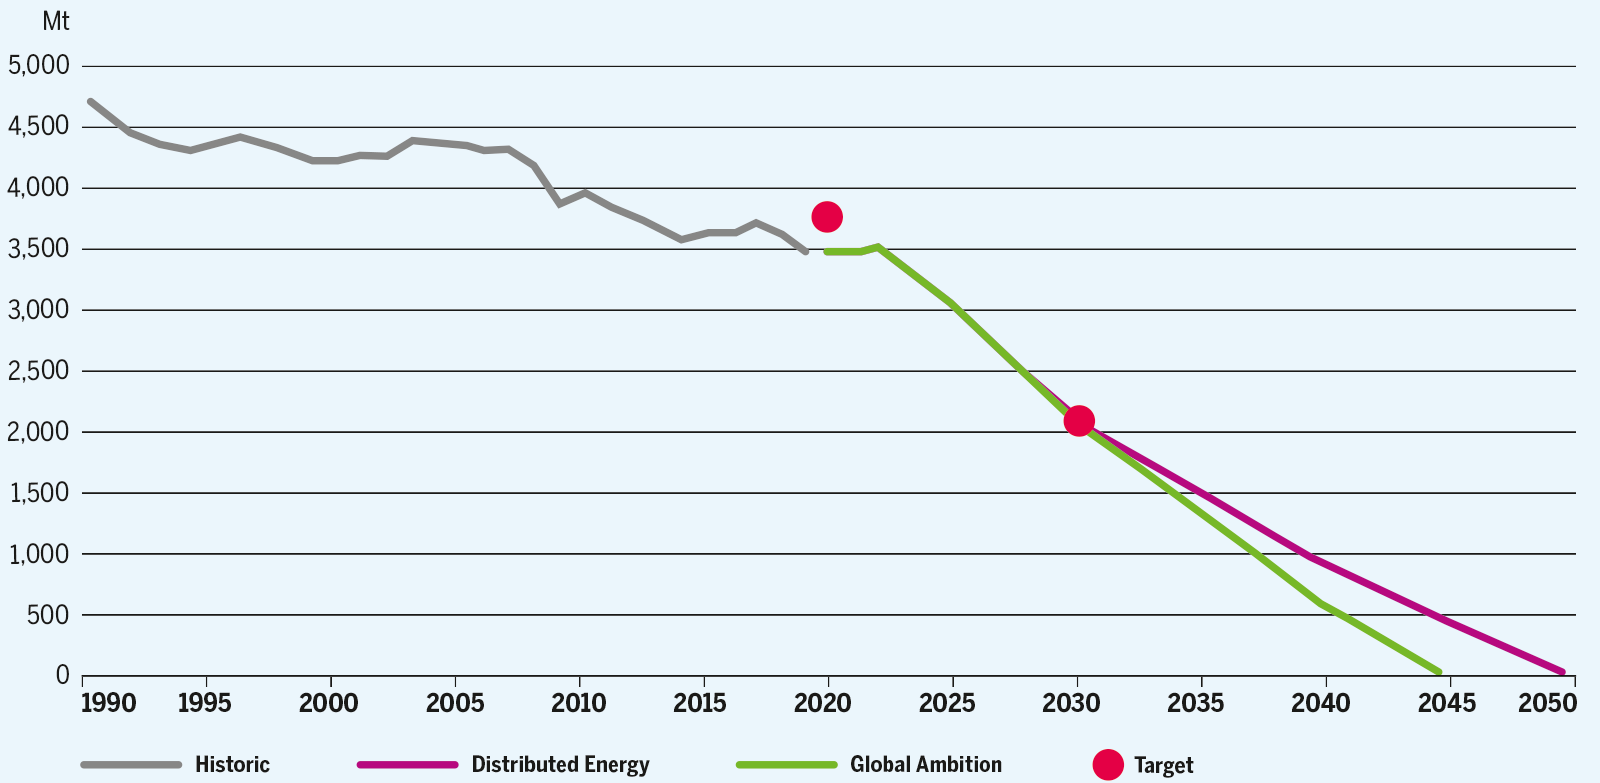
Figure 3.2: GHG emissions in Distributed Energy and Global Ambition
In the TYNDP 2020, ENTSOG and ENTSO-E used an EU-28 carbon budget based on population for the period of 2018 until 2100. For the TYNDP 2022, ENTSOG and ENTSO-E benchmark their scenarios against a carbon budget based on population, as well as a carbon budget based on equity3. To this end, the carbon budgets were recalculated, now considering the EU-27 scope and the historic emissions in 2018 and 2019. Table 1 provides an overview of the estimated carbon budget threshold following different methodologies. In 2018 and 2019 the EU already consumed a substantial part of the remaining carbon budget. As a result, the remaining EU-27 carbon budget is 35.1 Gt CO₂eq by population and 26.7 Gt CO₂eq by equity.
| Method | Based on population | Based on equity | ||||
|---|---|---|---|---|---|---|
| Period | 2018–2100 | 2020–2100 | Delta | 2018–2100 | 2020–2100 | Delta |
| EU-27 | 42.2 | 35.1 | –17 % | 33.8 | 26.7 | –21 % |
| UK | 6.2 | 5.3 | –15 % | 4.7 | 3.8 | –20 % |
| EU-28 | 48.5 | 40.4 | –17 % | 38.5 | 30.5 | –21 % |
Table 3.3: Remaining carbon budget expressed in Gt of CO₂ equivalents
3 The main approaches to define the European share in the global carbon budget are based on population or on equity. A methodology based on population assumes that all earth citizens are allowed to emit the same amount. A methodology based on equity assumes that developed nations should take responsibility for their high-carbon path to industrialisation during the 19th and 20th centuries. The calculation based on equity provides a lower carbon budget for the EU than a calculation based on population.
The cumulative emissions of Distributed Energy and Global Ambition have been assessed and benchmarked against aforementioned carbon budget thresholds. Figures 3 and 4 provide an overview. It can be concluded that with the current pace of annual GHG emissions, an overshoot of the calculated budget seems unavoidable. By 2022 it is expected that the EU-27 already consumed between 30 % and 40 % of the remaining carbon budget, depending on the calculation method. Despite the ambitious decarbonisation trajectories set in both the scenarios, the carbon budget based on population is reached around 2032. The budget based on equity is reached around 2027.
In Global Ambition the net cumulative emissions peak around 2045. Renewable energy combined with carbon capture and storage (CCS) contributes to bending the curve and recovering from the carbon budget overshoot.
Total cumulative emissions add up to 44.8 Gt by 2050, which means an overshoot of 9.7 Gt based on population and 18.0 Gt based on equity. Distributed Energy shows slightly higher cumulative emissions of 51.3 Gt, which represents an overshoot of between 16.2 and 24.5 Gt. This means that in both scenarios net negative emissions must be achieved after 2050 to reach the 1.5 °C target by 2100, with BECCS or direct aircapture (DAC) technologies for example.
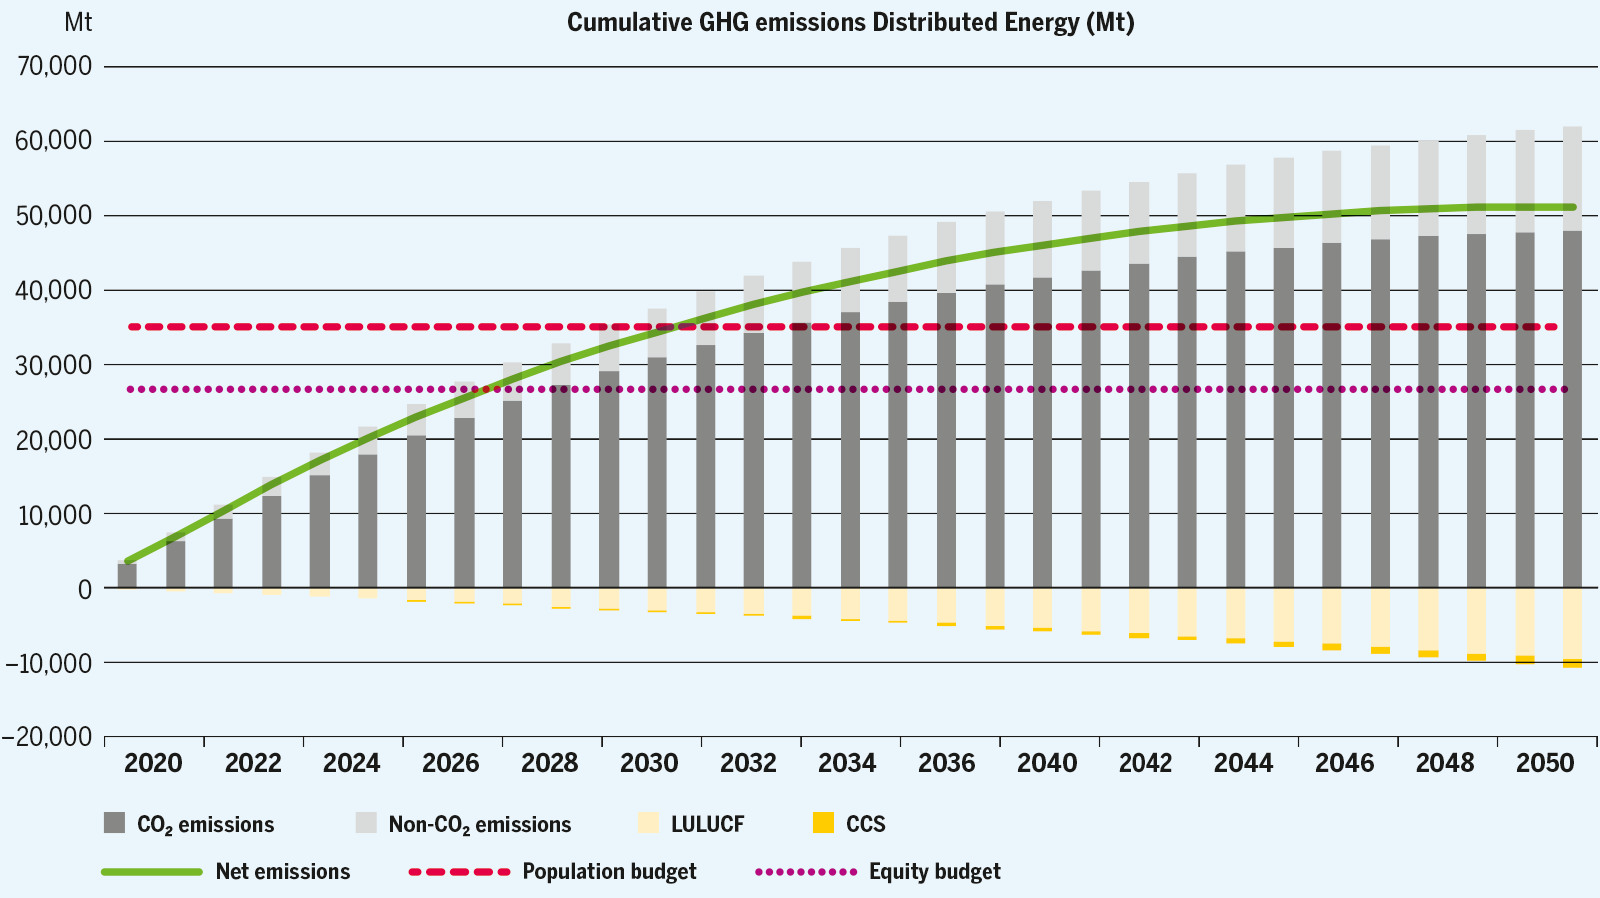
Figure 3.4: Cumulative emissions in the COP 21 scenarios – Distributed Energy
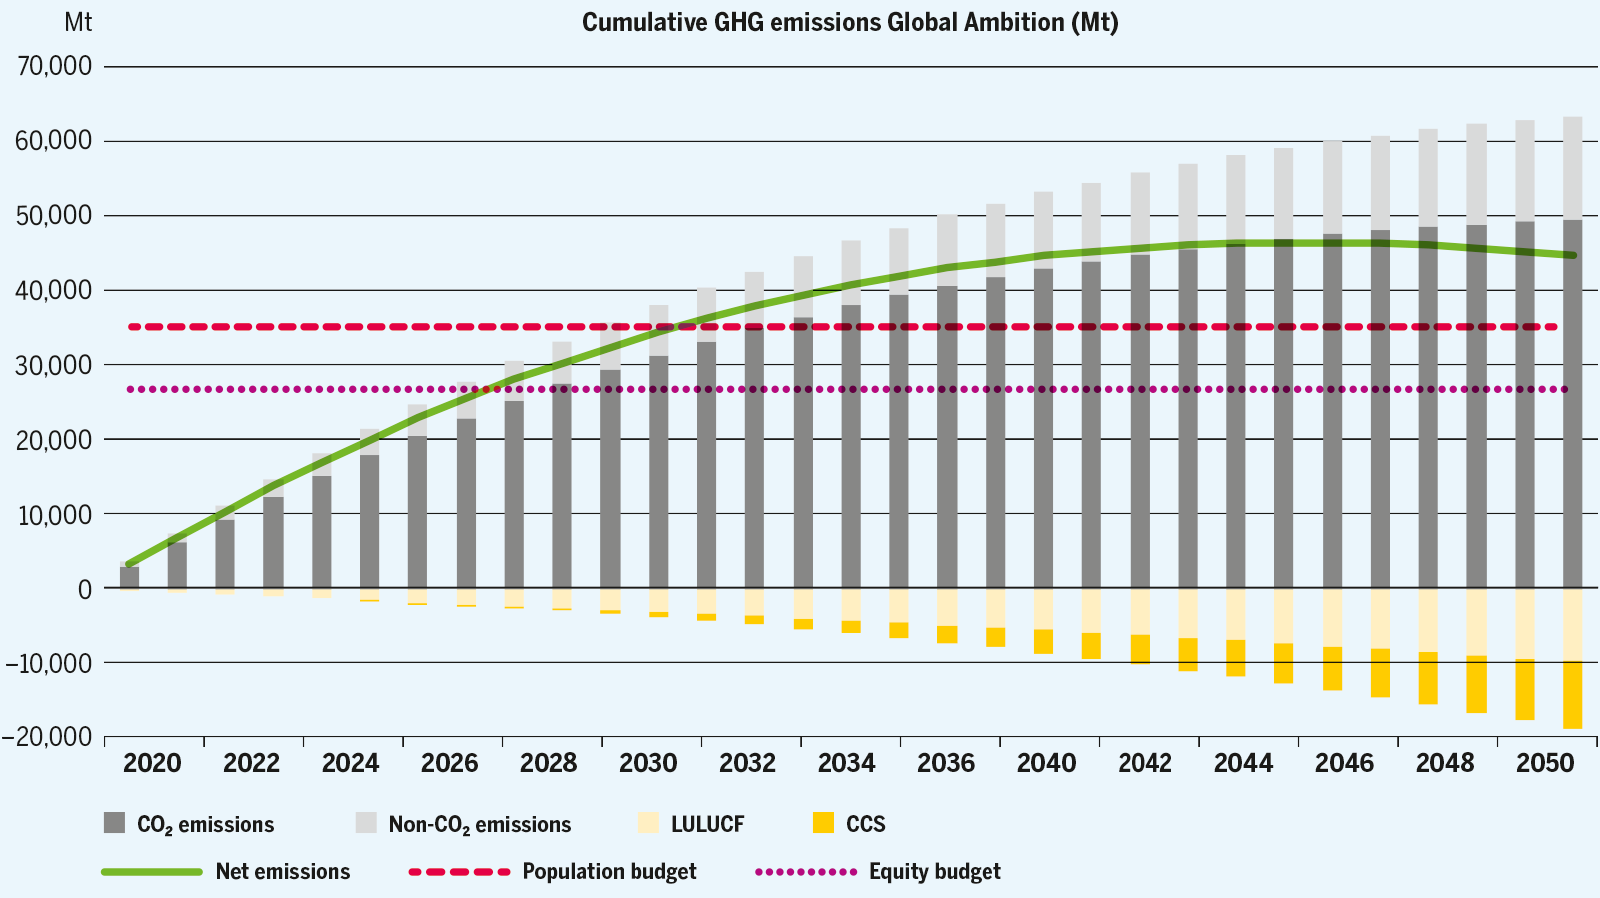
Figure 3.5: Cumulative emissions in the COP 21 scenarios – Global Ambition
3.2.1 With electrification, gas demand for power becomes more seasonal and critical
As electrification increases significantly in Global Ambition and to an even greater extent in Distributed Energy, the structure of the gas demand evolves as the demand for electricity becomes more seasonal and variable, requiring more flexibility amongst others from the gas system as well. As electrification increases, the seasonality of the gas demand remains significant since the heating demand shift towards electrification is compensated by the increasing seasonality of the electricity demand.
Furthermore, as the energy system relies on variable renewables to produce electricity and gas, the gas supply becomes sensitive to climatic events as well as the energy demand. This combined climatic sensitivity increases the need for flexibility. This translates in the scenarios by a higher winter demand for power, especially during climatic events like Dunkelflaute4 when gas demand for power generation increases to compensate for the absence of wind and solar energy during periods of several days.
The role of gas in power generation strongly evolves along the time horizon. First, there is a need to distinguish methane from hydrogen. In the present scenarios the increasing role of hydrogen in final demand translates into a similar evolution for gas-fired power generation with hydrogen replacing progressively a part of methane in this sector for the 2040- and 2050-time horizon.
Secondly, methane is progressively decarbonised offering the opportunity of flexible renewable and low carbon generation. While methane is now mostly natural gas, the share of biomethane increases along the time horizon to become fully decarbonised by 2050 in Distributed Energy.
4 “Kalte Dunkelflaute” or just “Dunkelflaute” (German for “cold dark doldrums”) expresses a climate case, where in addition to a 2-week cold spell, variable RES electricity generation is low due to the lack of wind and sunlight.
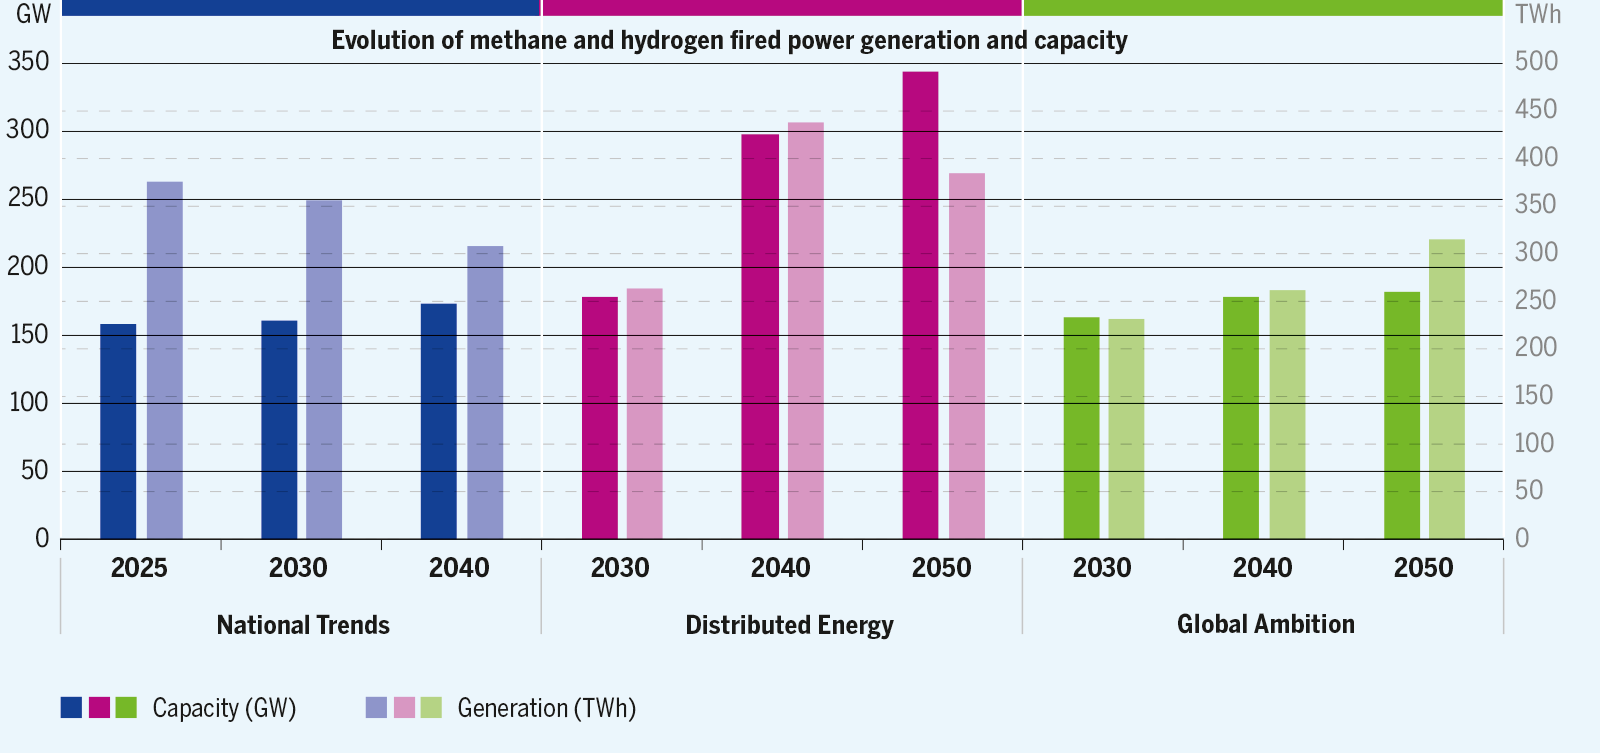
Figure 3.6: Gas demand for power generation (Capacity and Generation)
3.2.2 Methane and Hydrogen: two complementary energy carriers needed to meet the EU energy and climate objectives in an efficient way
Europe has significant potentials for producing renewable methane (e. g., biomethane) and hydrogen. Methane can also be associated with CCS technologies to be decarbonised and, using steam methane reforming (SMR), autothermal reforming (ATR), pyrolysis or other technology, converted to hydrogen. The analysis of the supply potentials for methane and hydrogen shows that for an efficient decarbonisation and to limit its dependence on imports, the EU needs to make use of all its sources of renewable energy in both Distributed Energy and Global Ambition scenarios. Therefore, for cost and energy efficiency reasons both methane and hydrogen demand coexist in both scenarios, to a different extent and with different evolutions depending on the storylines.
The comparison of National Trends and the COP 21 scenarios shows that, in many countries, current national policies do not always have a long-term vision post 2030 and do not consider yet a shift of the gas demand from methane towards hydrogen, nor do they consider significant CCU/S capacities.
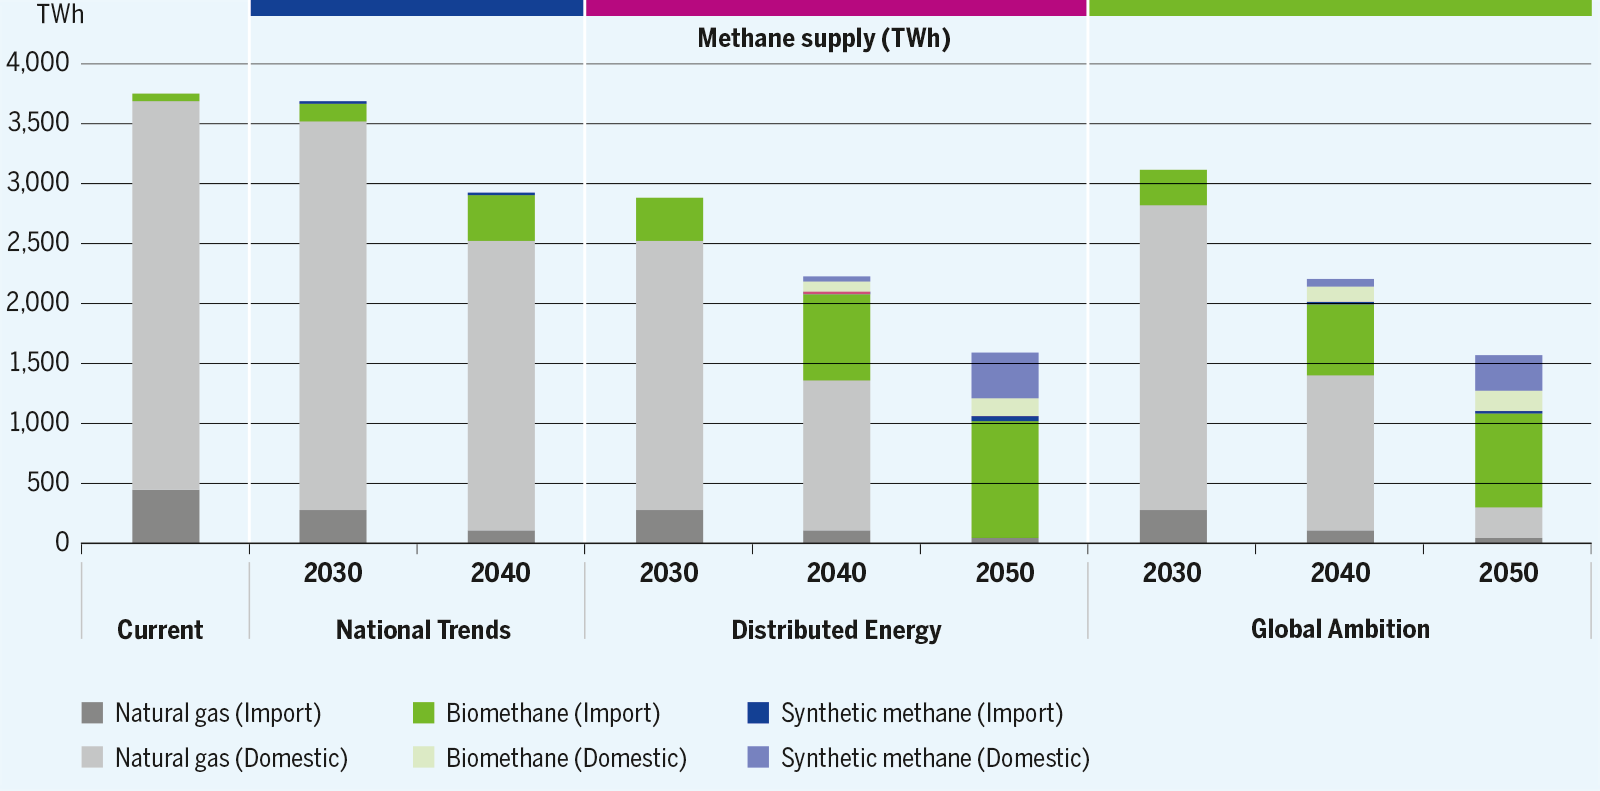
Figure 3.7: Methane supply for EU27
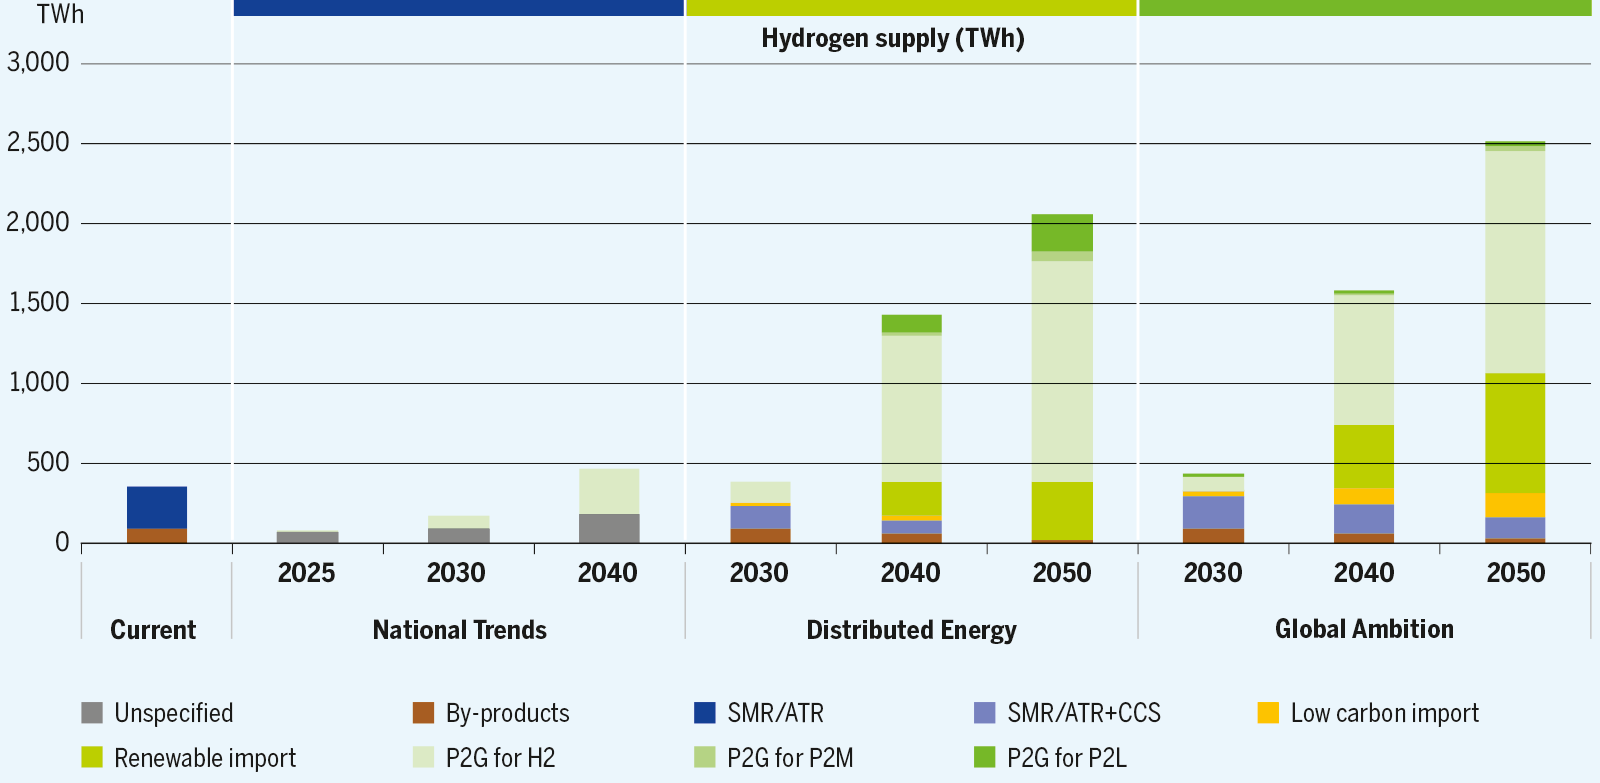
Figure 3.8: Hydrogen supply for EU27
3.2.3 The decarbonisation of the gas supply can be done in many ways
Gas can either be produced from renewable energy such as biomass producing biomethane or wind and solar energy producing hydrogen. Furthermore, decarbonised hydrogen can be produced with natural gas with different technologies such as SMR/ATR associated with carbon capture and storage technologies. Both COP 21 scenarios consider all types of technologies to a greater or lesser extent following their storyline. Each technology comes with its level of decarbonisation that is considered in the computation of the GHG emissions of each scenario to keep track of their carbon budget expenses. For instance, biomethane can be considered as carbon neutral or carbon negative if associated with CCS.
With the development of renewable hydrogen, biomethane and decarbonisation technologies, the EU can decarbonise its gas production by 2030 in Global Ambition and by 2040 in Distributed Energy. The EU indigenous production is largely decarbonised in 2040 in National Trends but not entirely, with about 100 TWh of remaining unabated natural gas. Distributed Energy shows the highest development of indigenous production capacities and a higher role for biomethane and hydrogen since the local production is prioritised. In Global Ambition, the indigenous production of methane and hydrogen also significantly increases but to a lesser extent compared to Distributed Energy.
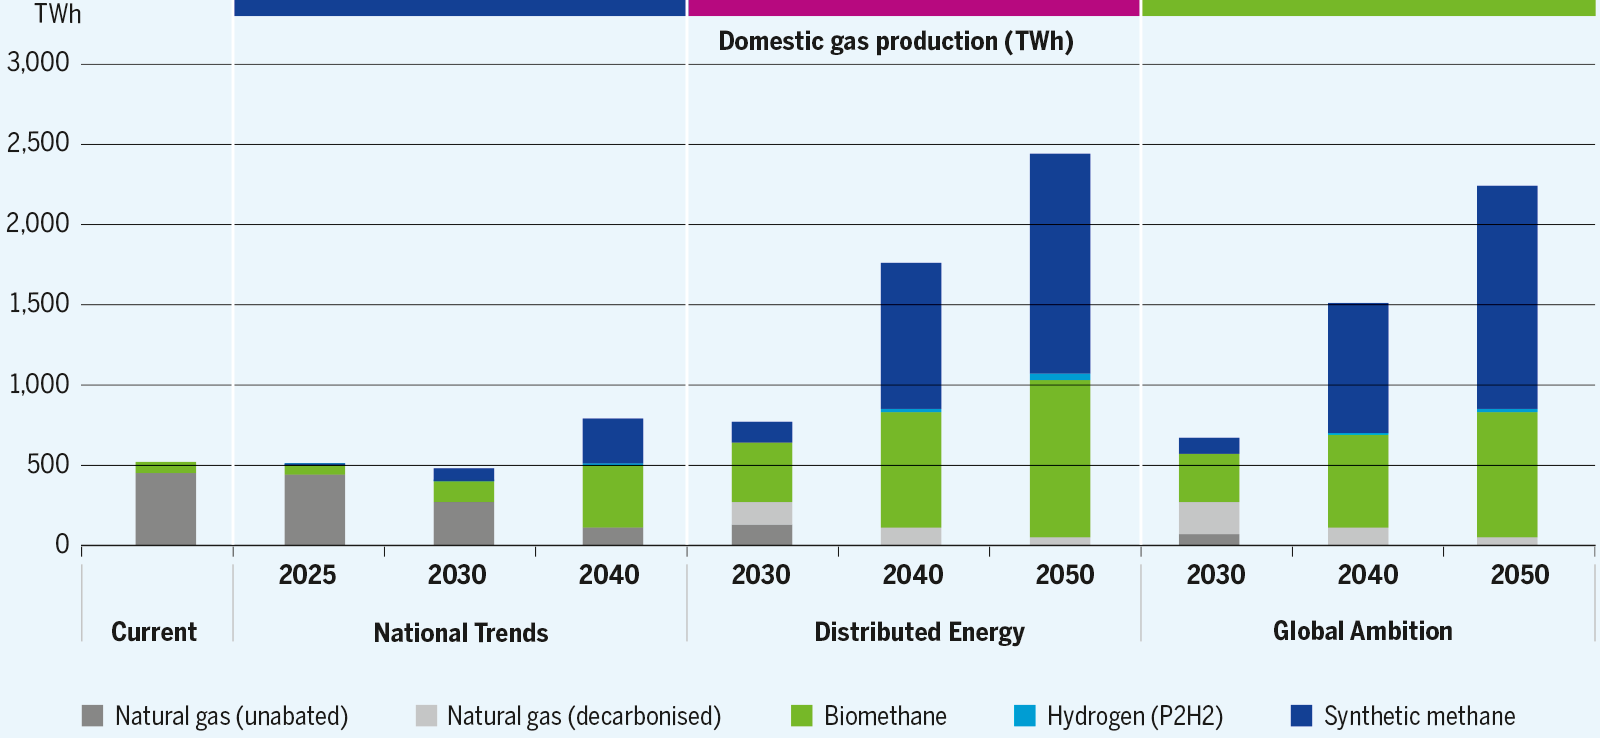
Figure 3.9: EU27 annual gas production per scenario (before REPowerEU adjustments)
3.2.4 Import capacities are key to ensure the transition and security of supply
With increasing system integration, the EU energy system increasingly relies on electricity and gas renewables to satisfy its energy demand since significant production capacities can be developed in the EU. Therefore, the EU energy demand only marginally relies on coal and oil, and liquids in general, which reduces the need for carbon intensive energy imports.
COP 21 scenarios show lower energy import needs compared to the EU Impact Assessment scenarios. However, the TYNDP 2022 scenarios confirm the need for gas import capacities to ensure the transition (production of decarbonised energy besides the development of renewable technologies) and to ensure the security of energy supply (see Security of supply chapter).
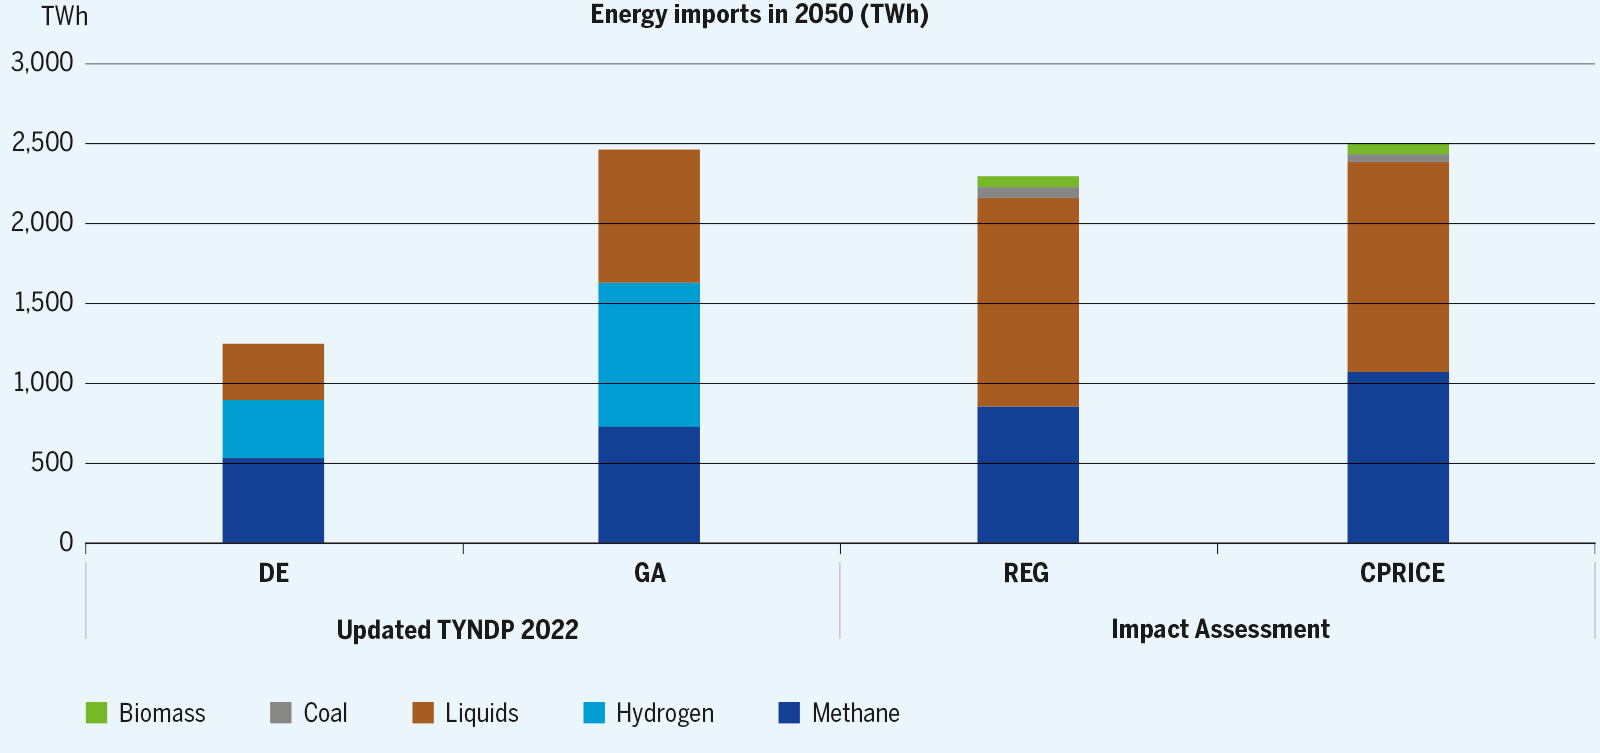
Figure 3.10: Energy imports to the EU in 2050 in TYNDP 2022 scenarios and EU Impact Assessment
3.3 Adjustment of the TYNDP 2022 to REPowerEU –
to increase EU independence
The invasion of Ukraine by Russia on 24 February 2022 has led to a major overhaul of energy policy objectives in terms of energy security and diversification of supply.
The TYNDP 2022 scenarios, published in April 2022, could not address and consider the requirements of the REPowerEU Plan. To include these ambitions into the perspective of the infrastructure development and its assessment, the TYNDP 2022 scenarios were adjusted by ENTSOG.
The aim was to keep the main findings of the published TYNDP 2022 report, in particular, linked to the use of electricity, while considering the major changes regarding gas supply. Therefore, ENTSOG has amended the TYNDP COP 21 scenarios – Distributed Energy and Global Ambition – for the year 2030 according to the REPowerEU Plan and its objectives of 10 mt domestic green hydrogen production and 10 mt hydrogen import.
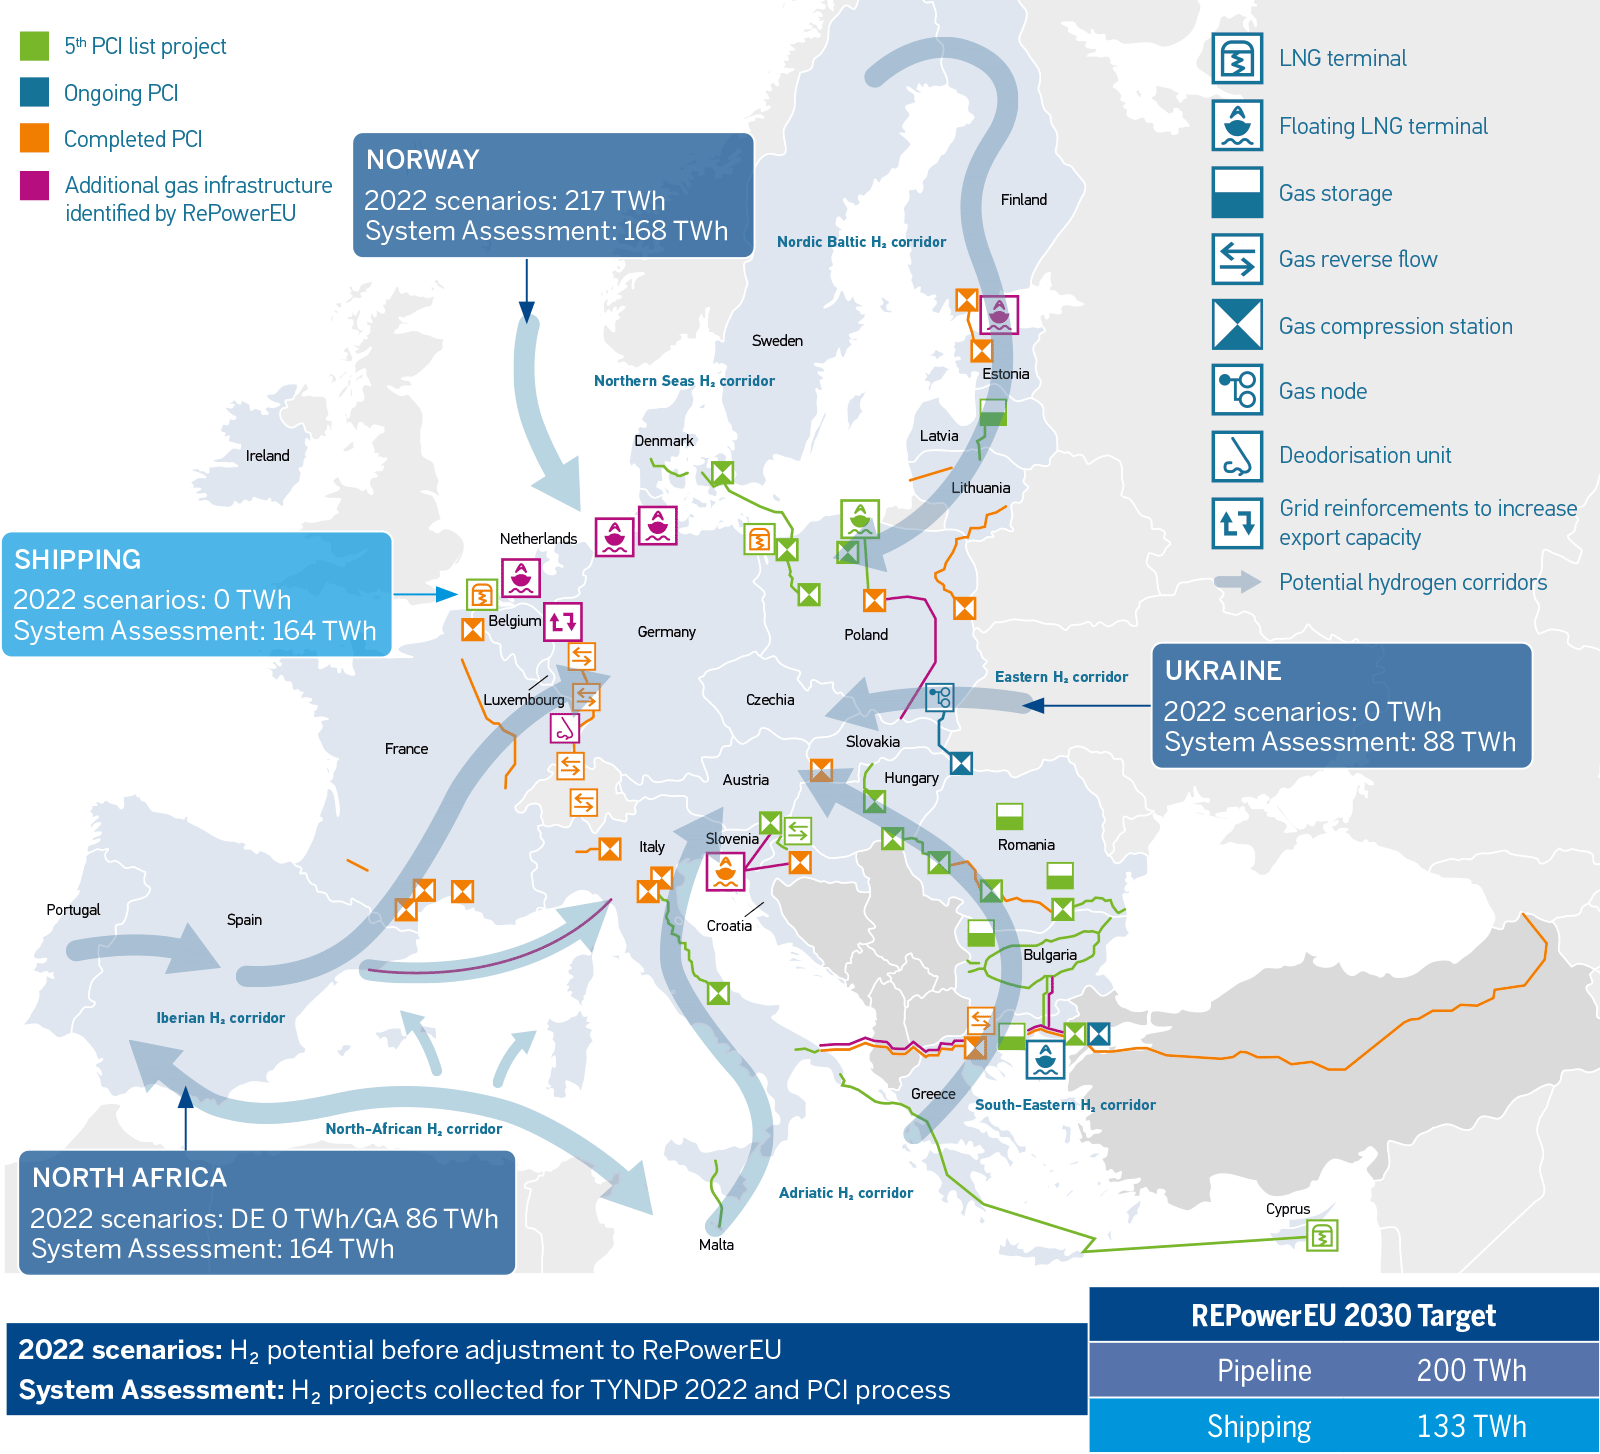
Figure 3.11: Updated potential extra EU H₂ supply in 2030
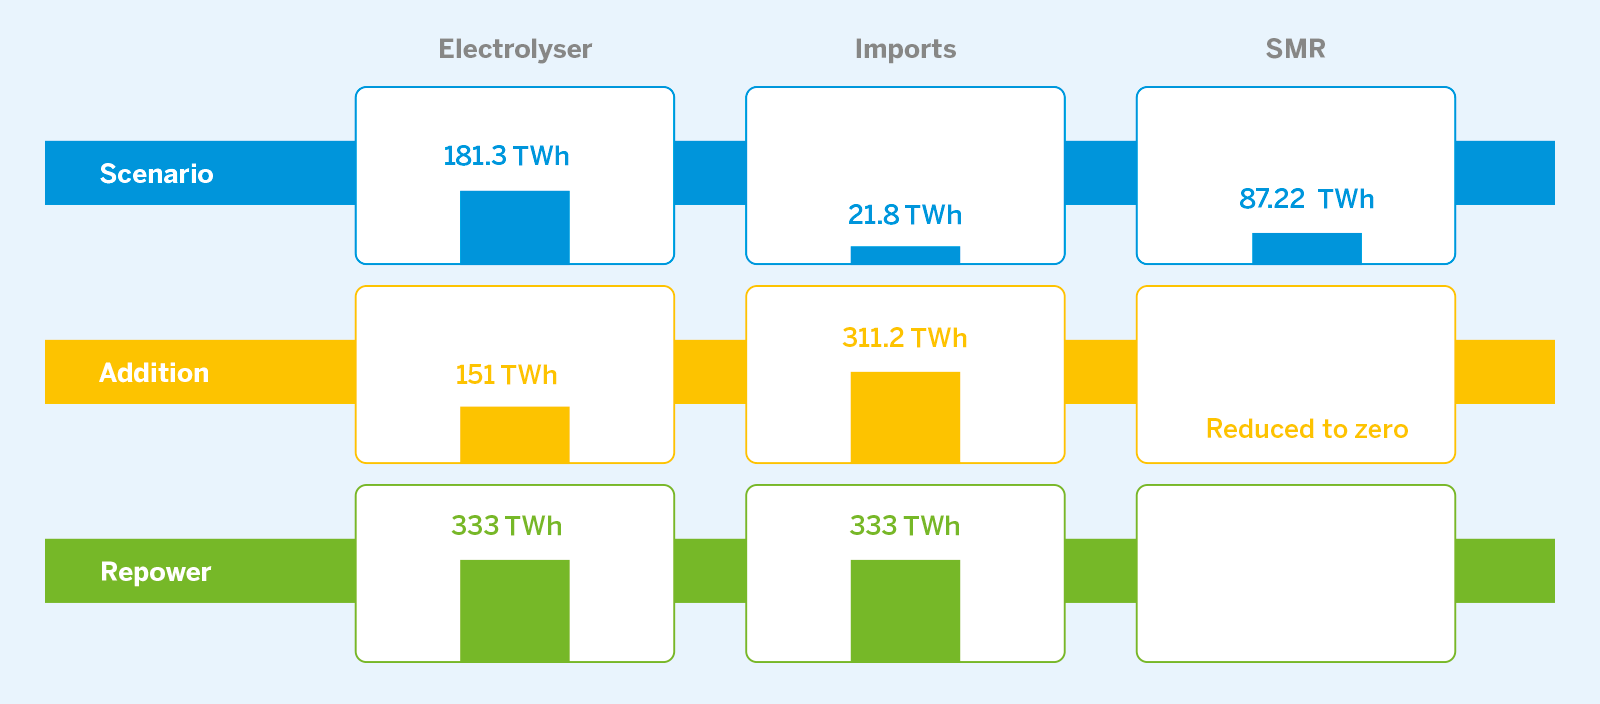
Figure 3.12: Reconstruction of hydrogen supply – Distributed Energy as example
In a second step, the import quantities and sources were adjusted to meet the 10 mt hydrogen import target. The import corridors mentioned in REPowerEU were considered and assigned with a capacity based on submitted projects5 within the framework of the TYNDP 2022 project collection.
In a third and last step, the hydrogen demand was increased to match the increased hydrogen supply. The identified gap of the hydrogen demand is distributed proportionally among the countries, considering country specific views. According to the REPowerEU plan, hydrogen will be used primarily in industry and transport sectors. The added hydrogen demand was assigned to these two sectors with an 80/20 ratio for industry and transport respectively. The added hydrogen demand was then subtracted from the natural gas demand for these two sectors.
5 Detailed information about the project collection is provided in the Infrastructure Report
6 Hydrogen extra demand was subtracted from the natural gas demand for industry and transport sectors
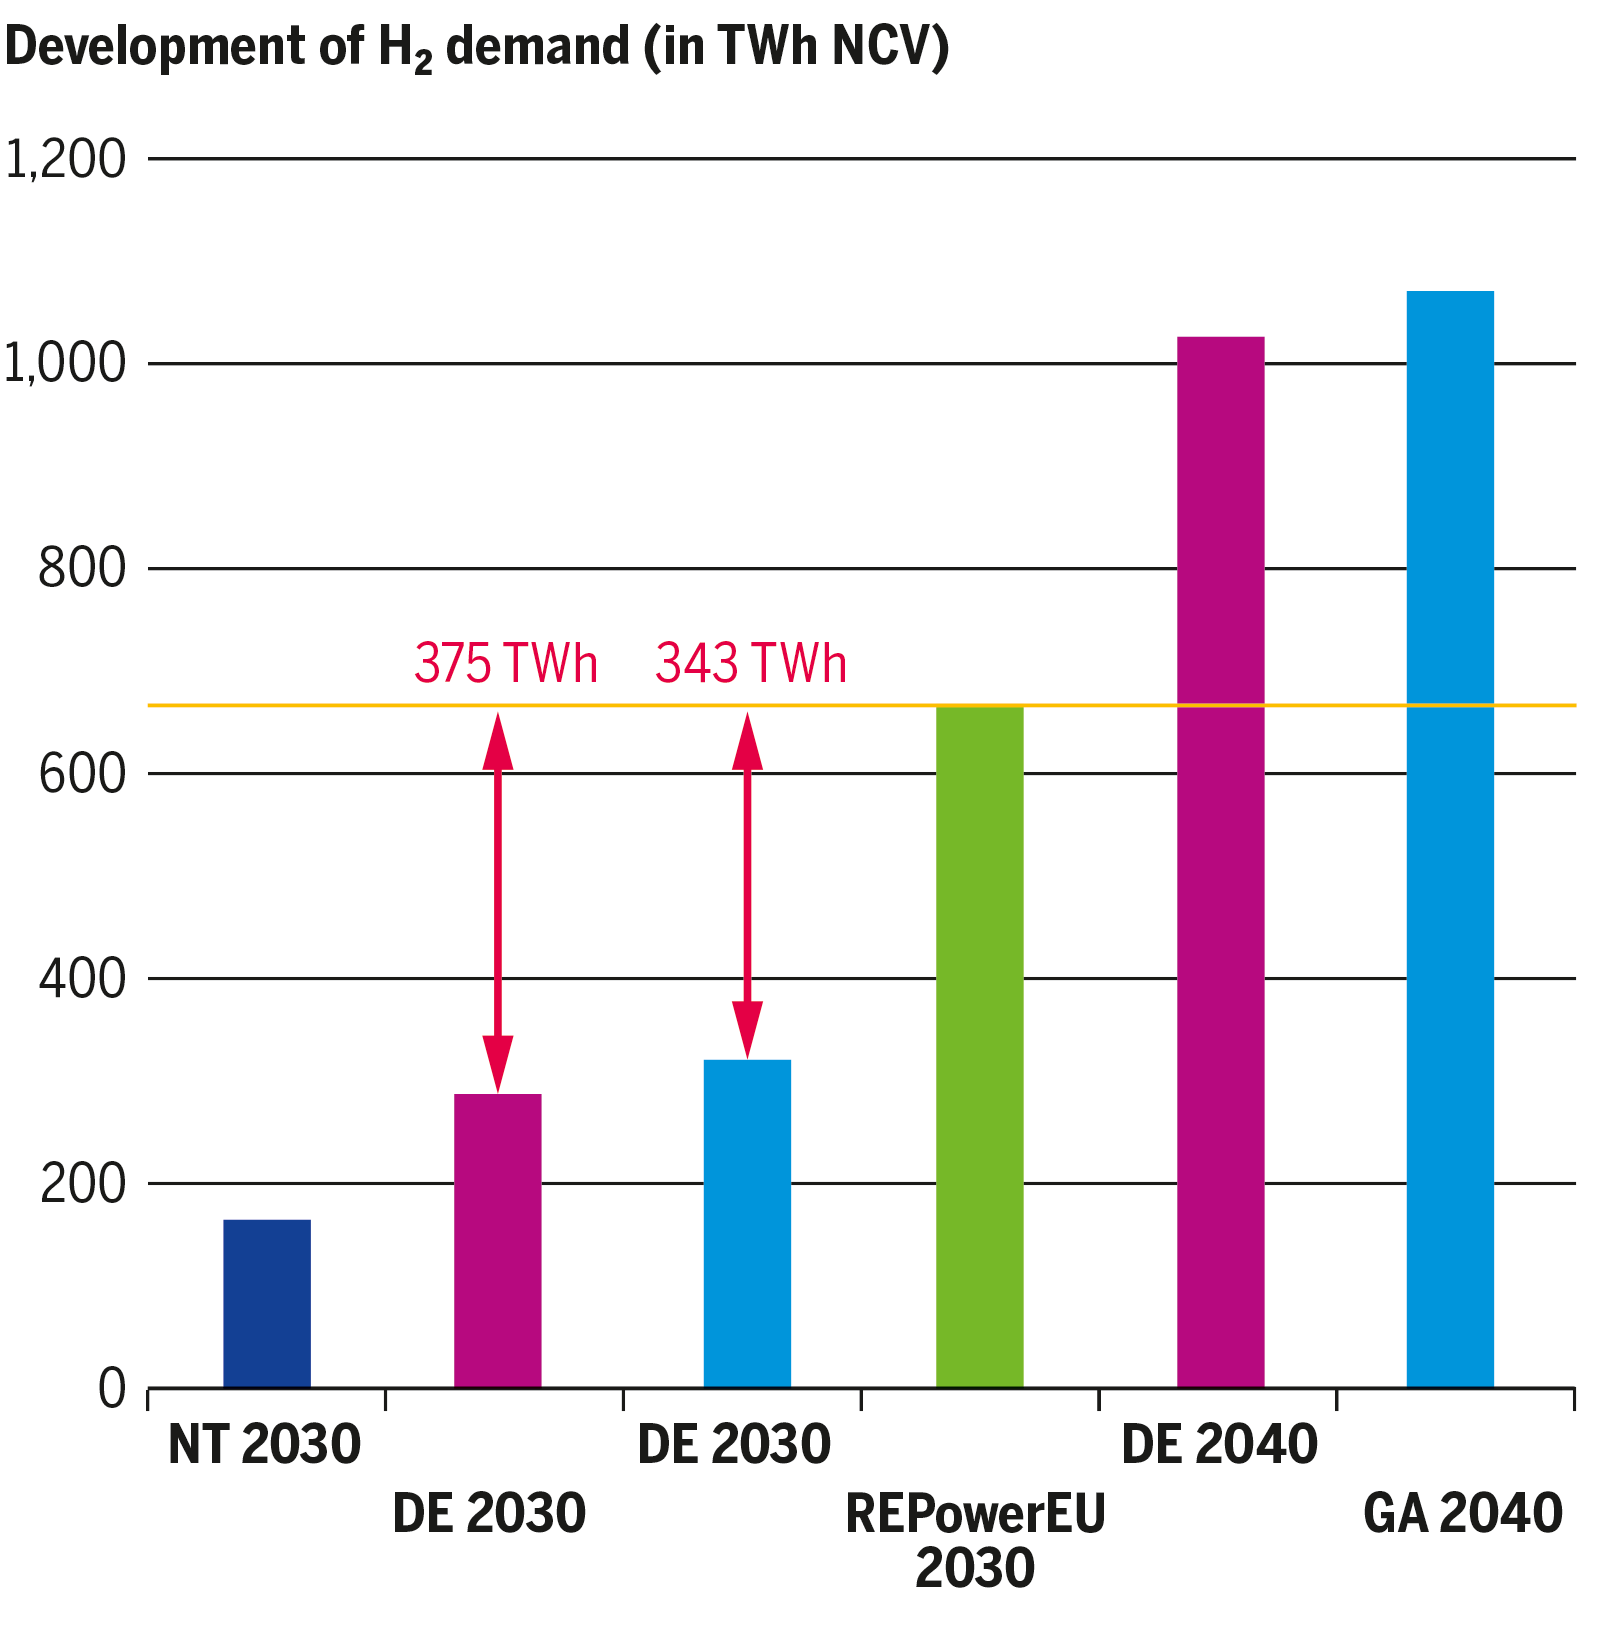
Figure 3.13: Adjustment of H₂ demand6
3.4 Hydrogen TYNDP 2022
For the previous TYDNP edition, ENTSOG introduced a new project infrastructure category for Energy Transition Projects. The TYNDP 2020 included 75 Energy Transitions Projects. Following the EU Green Deal and the revision process of the TEN-E Regulation, ENTSOG decided to further evolve this category by replacing this category by four new categories allowing more sector-related insights and displaying development trends. The TYNDP 2022 includes 215 investments relevant for these four new categories. They concern 26 countries. The new categories are:
- New or repurposed infrastructure to carry hydrogen (HYD)
- Projects for retrofitting infrastructure to further integrate hydrogen (RET)
- Biomethane development projects (BIO)
- Other infrastructure-related projects (OTH)
The extensive data collection carried out for TYNDP 2022, allowed for the consideration of hydrogen infrastructure levels as a first step on the assessment and analysis of hydrogen infrastructure. Among these new infrastructure categories the new categories detailed above, Hydrogen infrastructure projects were collected as part of the dedicated new hydrogen project category.
In addition, hydrogen projects included different subcategories of hydrogen infrastructure projects, such as:
- On-shore or off-shore Hydrogen transmission pipelines (newly constructed or repurposed from natural gas pipelines) including pipelines enabling hydrogen imports from extra-EU countries.
- Newly constructed or repurposed liquefied hydrogen terminal including hydrogen embedded in other chemical substances with the objective of injecting the hydrogen into the grid.
- Hydrogen storages (newly constructed or repurposed from natural gas infrastructure)
The TYNDP 2022 is the first one that includes Hydrogen infrastructure levels. These include not only Hydrogen infrastructure projects (as defined in the Practical Implementation Document of the TYNDP 2022) submitted to the TYNDP 2022, but also additional Hydrogen infrastructure projects that were submitted by December 2022 to the first PCI selection process under the revised TEN-E Regulation.
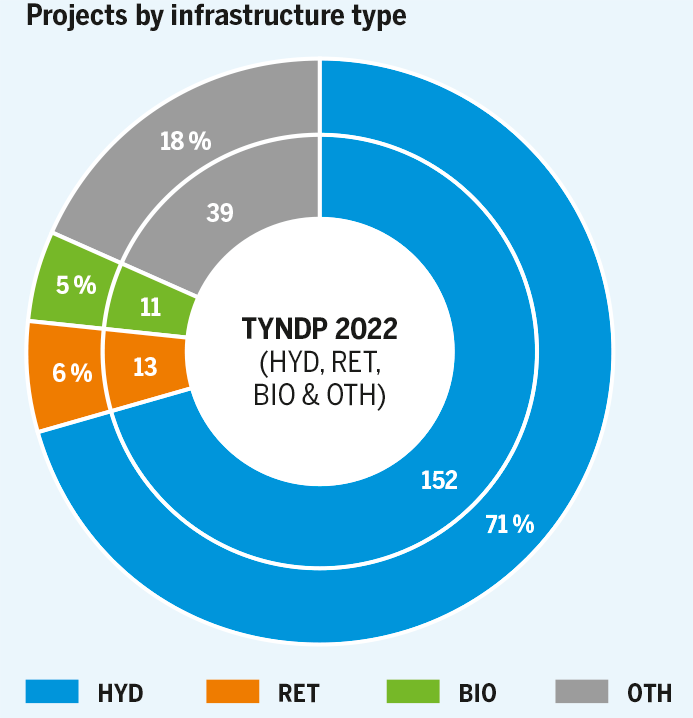
Figure 3.14: Projects representing new project categories included in the TYNDP 2022 per type of infrastructure (absolute number of respective investments and the equivalent share).
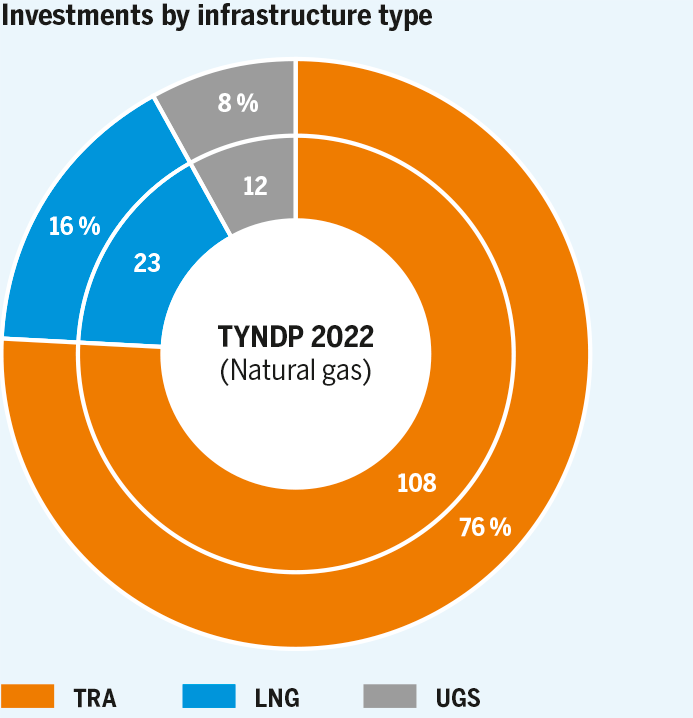
Figure 3.15: Projects representing methane categories included in the TYNDP 2022 per type of infrastructure (absolute number of respective investments and the equivalent share).
The addition of hydrogen projects submitted to the PCI project submission in the TYNDP 2022 edition is explained by the specific relationship between the TYNDP 2022 cycle and the ongoing first PCI selection process. As for the first PCI selection process, previous project submission to the TYNDP 2022 edition was not set a mandatory condition, unlike previous and future TYNDP/PCI processes.
Project promoters submitted 112 natural gas infrastructure projects (i. e., transmission, UGS and LNG projects) to the TYNDP 2022. For comparison, project promoters had submitted 142 methane infrastructure projects to the TYNDP 2020.
3.5 Conclusion
Gases are part of the solution towards net-zero 2050
The TYNDP scenarios confirm the need for various renewable and decarbonisation technologies and the interdependence of the gas and electricity systems in reaching a net-zero European energy system by 2050.
Indeed, as the energy transition will create a change in the use of primary energies depending partly on the level of electrification and on whether it is produced locally or centralised, gases as an energy carrier and their decarbonisation play a key role.
Adequate regulatory support is needed
New infrastructure projects may contribute to sustainability, decarbonisation, market integration, competition and diversification of gas supply sources or routes.
It is therefore important that the European regulatory framework continues ensuring adequate support to infrastructure developments that will allow to meet current and future needs.
Coordinated and coherent interaction between electricity and gases (including natural gas, biomethane, synthetic methane, and hydrogen)
To achieve climate goals under the European Green Deal in a cost-efficient way, a coordinated and coherent interaction between electricity and gases (including natural gas, biomethane, synthetic methane, and hydrogen) is essential.
Such an integrated approach addresses the development of crucial future infrastructure connections in an efficient and technology-neutral manner. Such an approach also reflects the increasing demand for hydrogen and the essential role of power-to-gas technologies.
Independence from Russia
The invasion of Ukraine by Russia on 24 February 2022 led to a major overhaul of energy policy objectives in terms of energy security and diversification of supply.
Future gas infrastructure evolution must consider the ongoing decarbonisation trend and a need to reduce Russian gas supply dependence and critical supply source dependence in general.