Picture courtesy of Gas Connect Austria
10 Norway Hydrogen Supply Disruption
Norway Hydrogen supply disruption does not impact simulations results in 2025 Best Estimate and in National Trends demand scenarios (2030 and 2040); in those scenarios, there is no hydrogen import potential and methane demand curtailment is not impacted compared to the Reference Case. The infrastructure assessment is limited to Distributed Energy and Global Ambition demand scenarios in 2030, 2040 and 2050.
10.1 Yearly demand
10.1.1 Methane Results
10.1.1.1 Existing Methane Infrastructure
In infrastructure Level 1, Norway hydrogen supply disruption impact only one demand scenario and one year. In 2040 Global Ambition, Hungary, Romania, Serbia, Bulgaria and North Macedonia show 2 % demand curtailment. Neighbouring countries cannot cooperate due to bottlenecks and do not mitigate demand curtailment.
In infrastructure Level 2, this 2 % demand curtailment in the east is fully mitigated.
10.1.1.2 Advanced and PCI Methane Infrastructure
There is no demand curtailment at all in Advanced and PCI Methane Infrastructure levels.
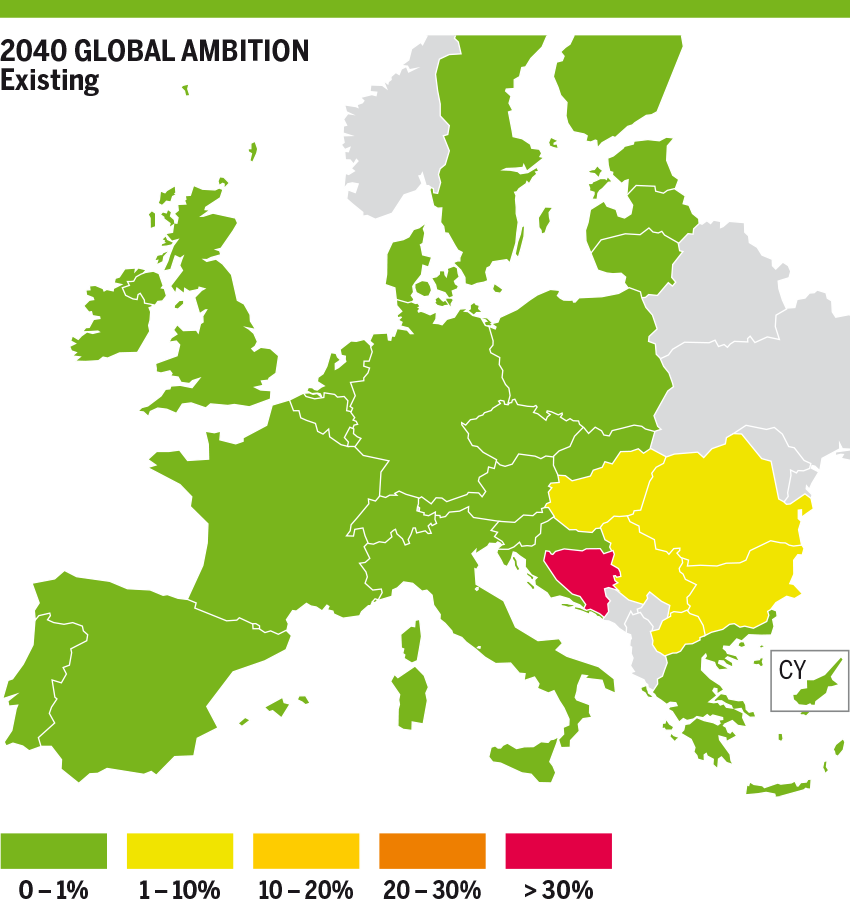
Figure 10.1: NO H₂ Supply Disruption – Methane Results for Yearly Demand in Existing CH₄ Infrastructure
10.1.2 Hydrogen Results
10.1.2.1 Existing Methane Infrastructure
- 2030
H₂ Infrastructure Level 1
In Distributed Energy scenario, only countries not interconnected show demand curtailment Ireland 33 %, United Kingdom 46 %, Luxembourg 61 %, Slovenia 86 %, and Serbia 100 %. Other countries compensate the Norway supply disruption with additional Hydrogen produced with methane due to the flexibility of the methane infrastructure. In the Global Ambition scenario, we obtain the same results with different values of demand curtailment: Ireland 37 %, United Kingdom 46 %, Luxembourg 55 %, Slovenia 89 % and Serbia 100 %.
H₂ Infrastructure Level 2
Demand curtailment is fully mitigated in both scenarios due to the additional interconnection for the isolated countries in Infrastructure Level 1.
- 2040
H₂ Infrastructure Level 1
In Distributed Energy scenario, most of the countries show demand curtailment (10 %). Italy, Switzerland and Austria show 8 % demand curtailment and cannot cooperate more with countries in the north due to infrastructure limitations between Austria and Germany. Eastern countries (Greece, Bulgaria, Romania, Hungary, Croatia and Slovakia) show 3 % to 5 % demand curtailment and cannot cooperate more due to infrastructure bottlenecks between Slovakia and Czech Republic, Slovakia and Austria, Hungary and Slovenia and Croatia to Slovenia. Romania cannot cooperate with Bulgaria due to a bottleneck and cannot mitigate demand curtailment in Bulgaria and Greece. Italy and Austria show 8 % demand curtailment and cannot cooperate with Germany due to a bottleneck between Austria and Germany. France also show 8 % demand curtailment and cannot cooperate more with Germany. Some countries which are not interconnected also show demand curtailment: United Kingdom 67 %, Luxembourg 83 % and Serbia 100 %.
In Global Ambition scenario, most of the countries show 22 % demand curtailment. Eastern countries Greece, (Romania, Hungary, Croatia and Slovakia) show 15 % demand curtailment and cannot cooperate more due to infrastructure bottlenecks between Slovakia and Czech Republic, Slovakia and Austria, Hungary and Slovenia and Croatia to Slovenia. Bulgaria and Greece show 17 % demand curtailment and Romania cannot cooperate with Bulgaria to mitigate demand curtailment due to a bottleneck) France, Italy, Switzerland and Austria show 20 % demand curtailment and cannot cooperate more with Germany. Spain shows 22 % demand curtailment and Portugal (20 %) and France (20 %) demand curtailment cannot cooperate to mitigate its demand curtailment. Some countries not interconnected show demand curtailment: Ireland 50 %, United Kingdom 71 %, Luxembourg 86 % and Serbia 100 %.
H₂ Infrastructure Level 2
In Distributed Energy scenario, most of the countries mitigate their demand curtailment to 2 % (including countries not interconnected in Infrastructure Level 1). Eastern countries (Greece, Bulgaria, Romania, Hungary, Croatia and Slovakia) are not curtailed and cannot cooperate more due to infrastructure bottlenecks between Slovakia and Czech Republic, Slovakia and Austria, Hungary and Slovenia and Croatia to Slovenia.
In Global Ambition scenario, most of the countries show only 6 % demand curtailment (including countries not interconnected in Infrastructure Level 1). Eastern countries (Greece, Bulgaria, Romania, Hungary, Croatia and Slovakia) show no demand curtailment and cannot cooperate more due to infrastructure bottlenecks between Slovakia and Czech Republic, Slovakia and Austria, Hungary and Slovenia and Croatia to Slovenia. Italy, Austria and Slovenia cannot cooperate more with Germany due to infrastructure limitations between Austria and Germany.
- 2050
H₂ Infrastructure Level 1
In Distributed Energy scenario, most of the countries show demand curtailment (20 % to 22 %). Italy, Switzerland, Slovenia and Austria show 20 % demand curtailment and cannot cooperate more with countries in the north due to infrastructure limitations between Austria and Germany. Eastern countries (Greece, Bulgaria, Romania, Hungary, Croatia and Slovakia) are showing only 3 % demand curtailment but and cannot cooperate more due to infrastructure bottlenecks between Slovakia and Czech Republic, Slovakia and Austria, Hungary and Slovenia and Croatia to Slovenia. Portugal with 8 % demand curtailment cannot cooperate with Spain due to infrastructure limitations between Portugal and Spain. Some countries not interconnected show demand curtailment: United Kingdom 28 %, Luxembourg 87 % and Serbia 100 %.
In Global Ambition scenario, most of the countries show 33 % demand curtailment. Greece shows 39 % demand curtailment due to infrastructure bottleneck between Bulgaria and Greece. France shows 26 % demand curtailment and cannot cooperate with Belgium, Germany and Spain due to infrastructure limitations. Portugal shows 27 % demand curtailment and cannot cooperate with Spain due to infrastructure limitations (bottleneck between Portugal and Spain). Some countries not interconnected show demand curtailment: Ireland 27 %, United Kingdom 49 %, Luxembourg 91 % and Serbia 100 %.
H₂ Infrastructure Level 2
In Distributed Energy scenario, most of the countries mitigate their demand curtailment to 6 % (including countries not interconnected in Infrastructure Level 1). Italy, Switzerland, Slovenia and Austria fully mitigate their demand curtailment and cannot cooperate more with countries in the north due to infrastructure bottleneck between Austria and Germany. Eastern countries (Greece, Bulgaria, Romania, Hungary, Croatia and Slovakia) also fully mitigate demand curtailment and cannot cooperate more due to infrastructure bottlenecks between Slovakia and Czech Republic, Slovakia and Austria, Hungary and Slovenia and Croatia to Slovenia.
In Global Ambition scenario, all countries fully mitigate their demand curtailment.
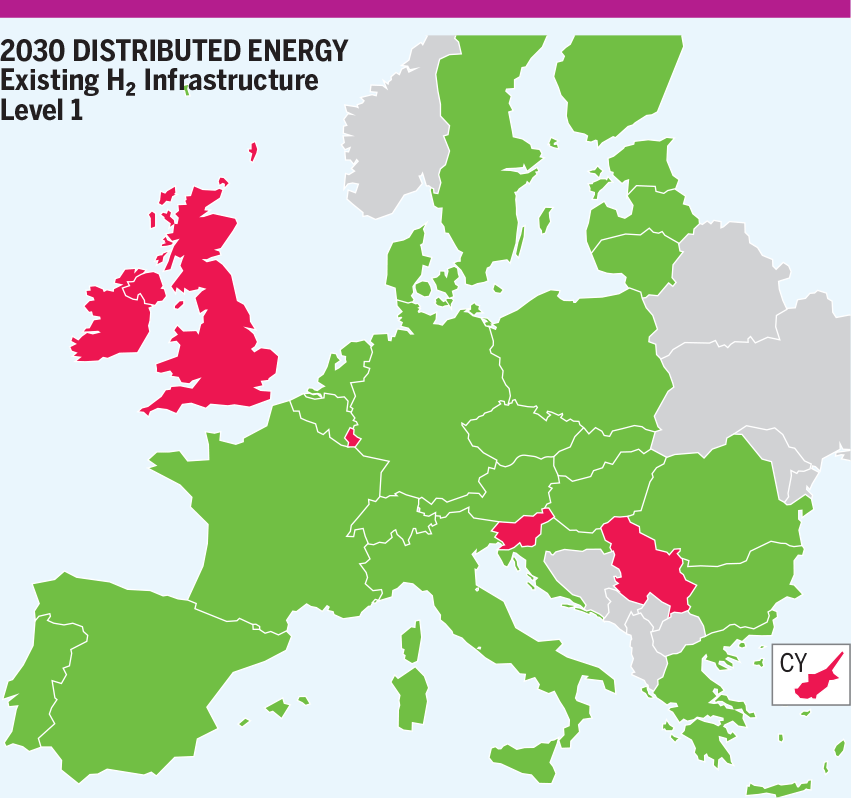
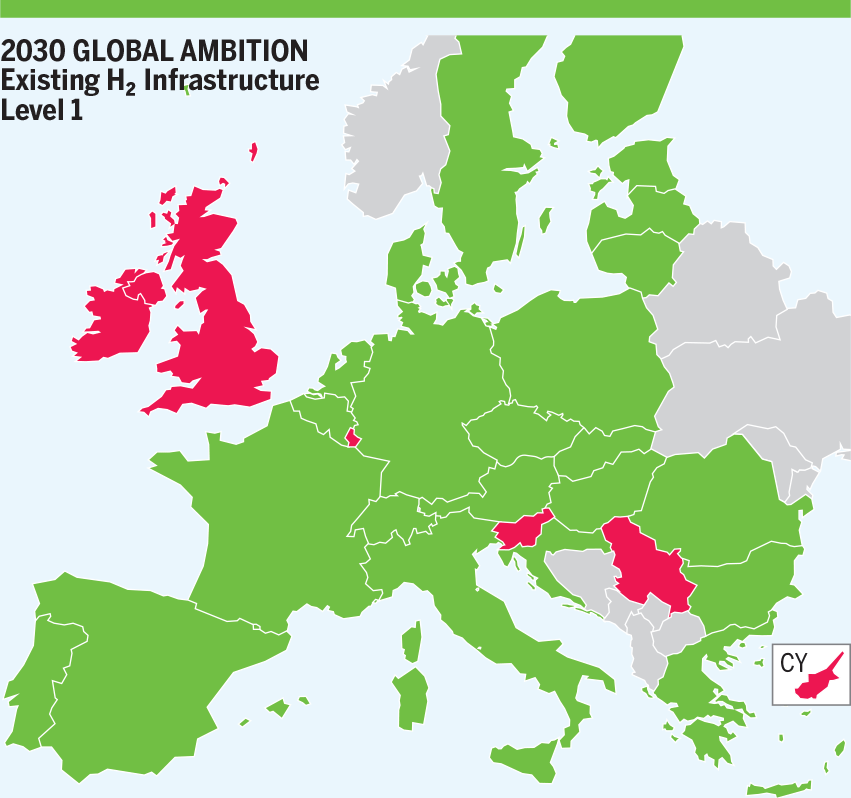
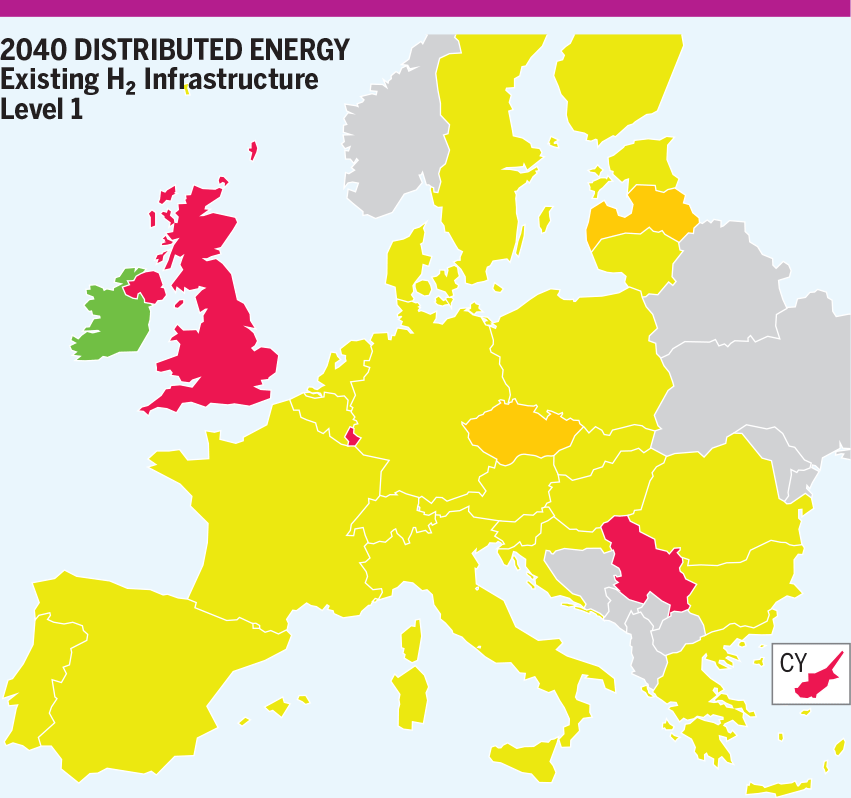
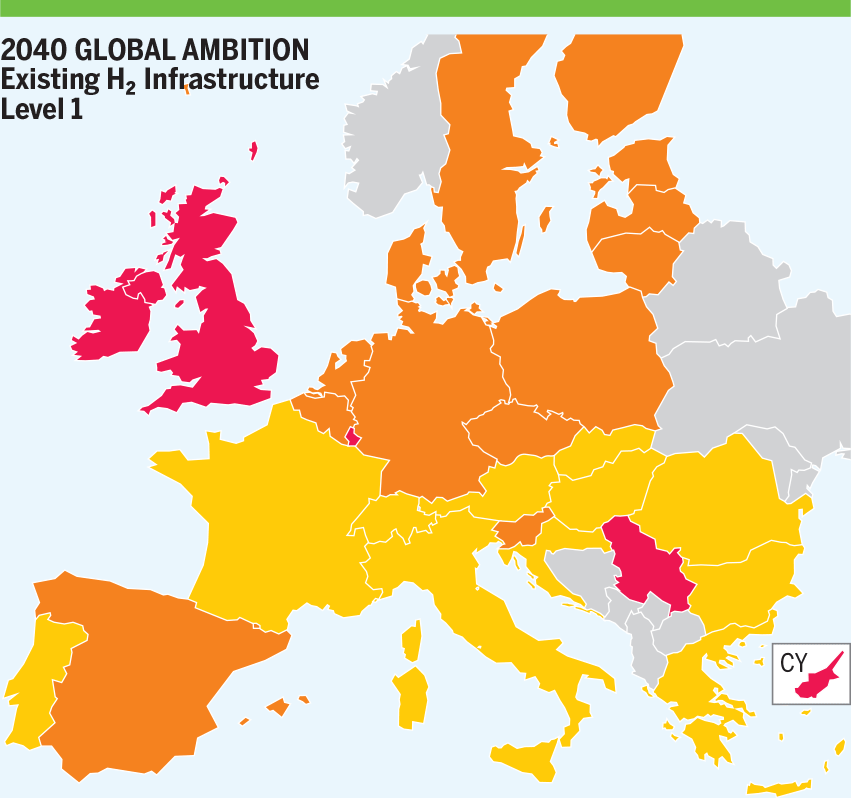
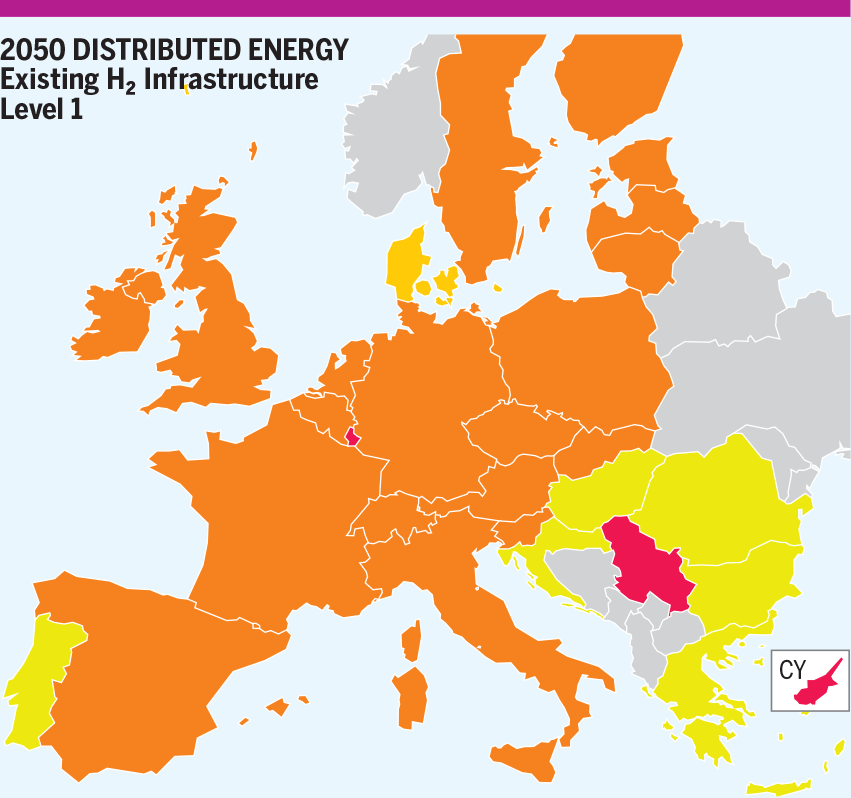
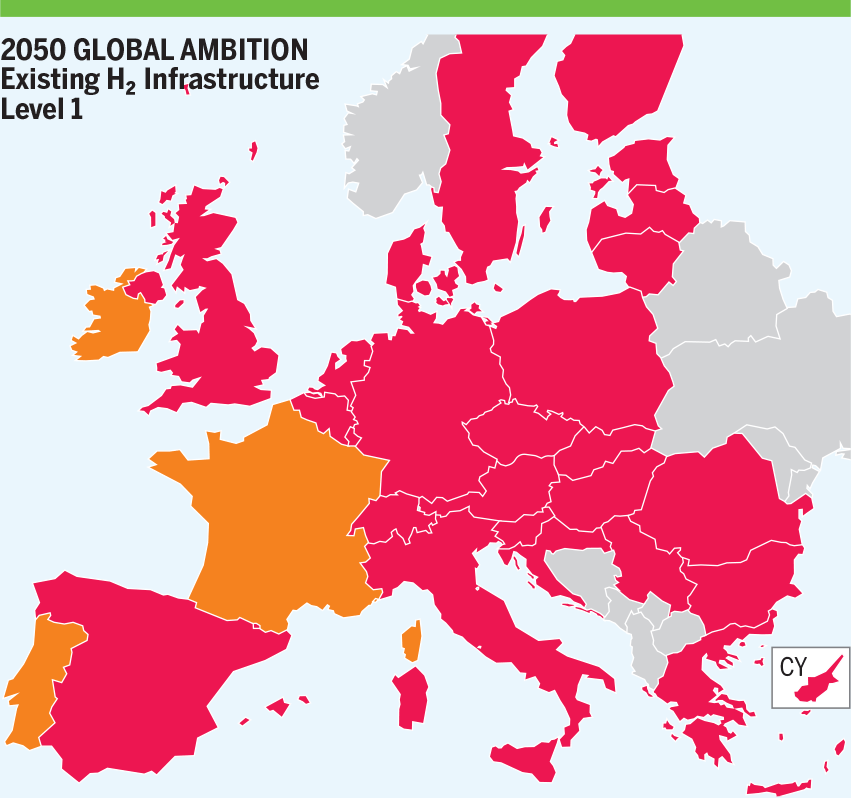

Figure 10.2a: NO H₂ Supply Disruption – Hydrogen Results for Yearly Demand in Existing CH₄ Infrastructure and H₂ Level 1
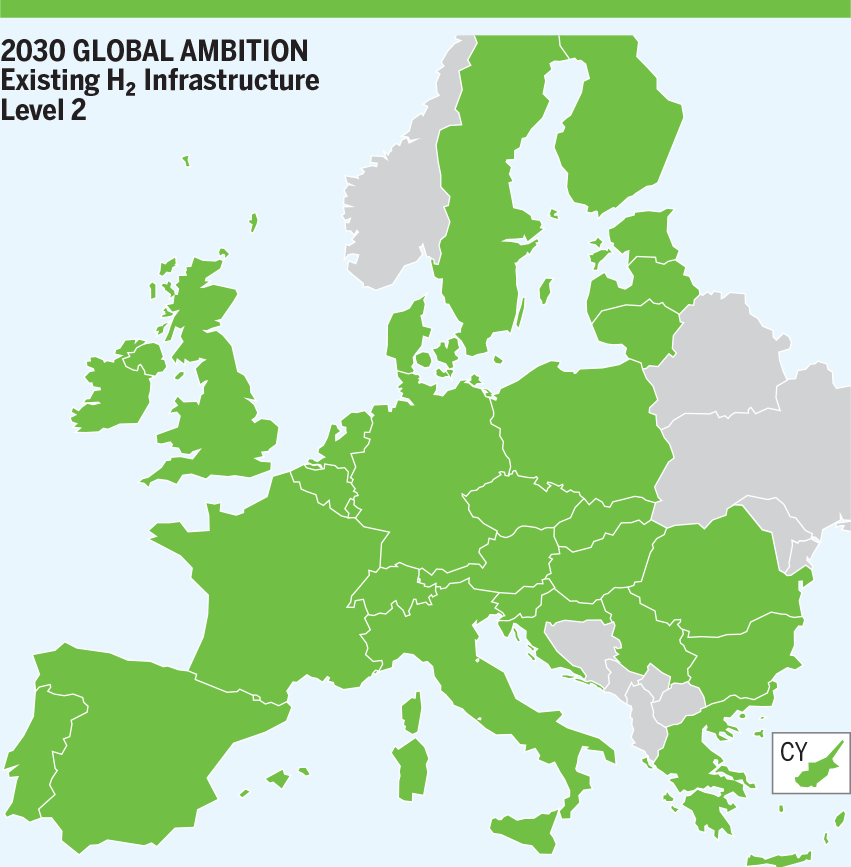
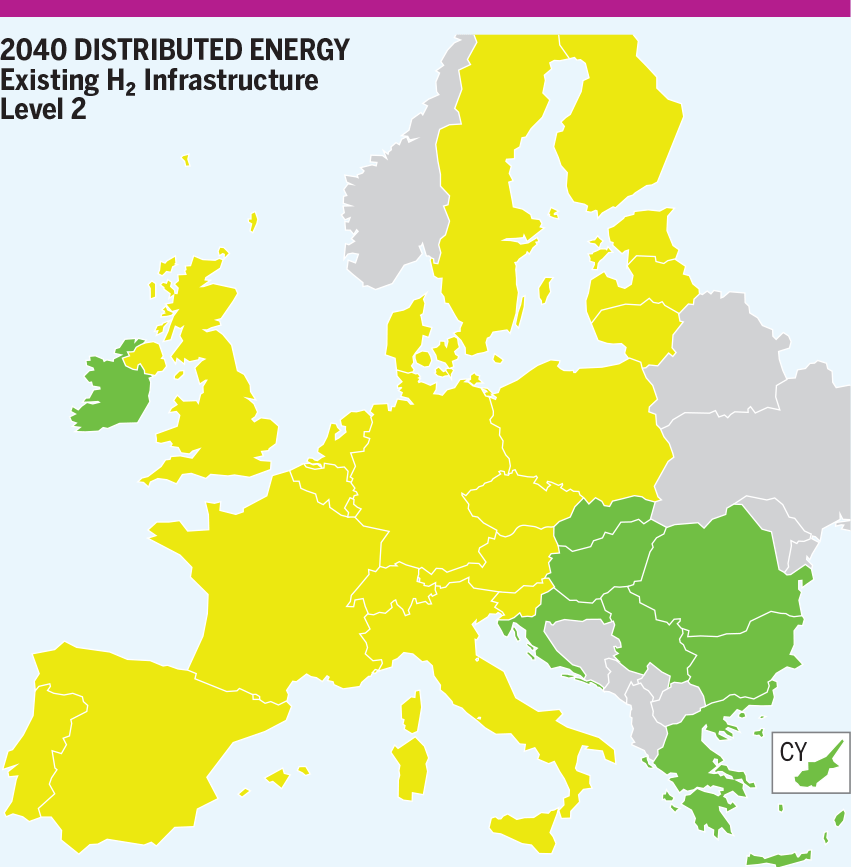
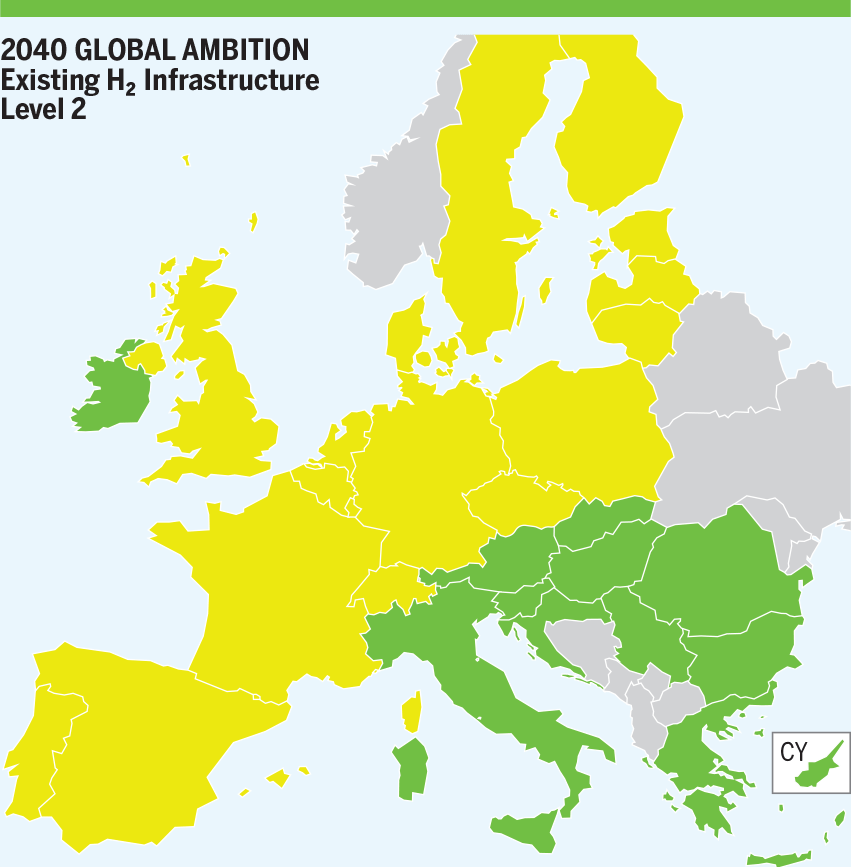
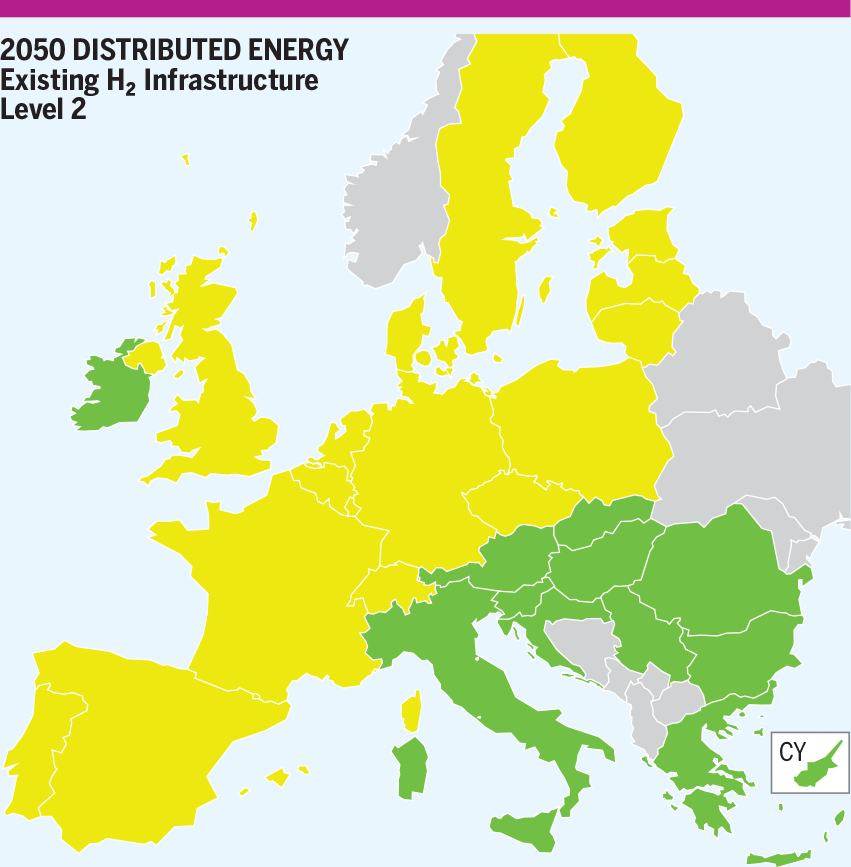


Figure 10.2b: NO H₂ Supply Disruption – Hydrogen Results for Yearly Demand in Existing CH₄ Infrastructure and H₂ Level 2
10.1.2.2 Advanced and PCI Methane Infrastructure
Advanced and PCI infrastructure levels show no difference with Existing infrastructure level concerning hydrogen simulation results.
10.2 2-Week Cold Spell demand
The 2-Week Dunkelflaute country demands are generally very similar to the 2-Week Cold Spell demand values. Hydrogen demand is the same for Best Estimate and National Trends scenarios and it is also the same in the year 2030 of Distributed Energy and Global Ambition scenarios. Regarding Distributed Energy and Global Ambition scenarios in 2040 and 2050, only Italy, The Netherlands, Romania and United Kingdom show higher values in 2-Week Dunkelflaute.
Regarding the methane demand values, only Bulgaria, Czech Republic, Germany, Croatia and Italy present slight differences when comparing demand of 2-Week Dunkelflaute with 2-Week Cold in Best Estimate and National trends scenarios.
In Distributed Energy and Global Ambition scenarios just Spain, France, Greece, Italy, The Netherlands, Portugal, Romania and United Kingdom present higher methane demand in 2-Week Dunkelflaute.
Consequently, the curtailment rate results in 2-Week Dunkelflaute and in 2-Week Cold Spell are exactly the same for most of the countries. The countries with higher demand in 2-Week Dunkelflaute are only increasing their demand curtailment rate in 1 or 2 % maximum.
10.2.1 Methane Results
10.2.1.1 Existing Methane Infrastructure
Demand curtailment results are similar to the curtailment rates in the Reference case. The Norway Hydrogen disruption does not impact the methane simulation results.
10.2.1.2 Advanced and PCI Methane
Demand curtailment is fully mitigated as in Reference case. The Norway Hydrogen disruption does not impact the methane simulation results.
10.2.2 Hydrogen Results
10.2.2.1 Existing Infrastructure
- 2030
H₂ Infrastructure Level 1
In Distributed Energy scenario, all countries show demand curtailment. Serbia, Slovenia, United Kingdom, Luxembourg, Croatia and Ireland show respectively 100 %, 89 %, 71 %, 70 %, 38 % and 43 % demand curtailment. These countries are not connected to hydrogen infrastructure and do not satisfy their demand with their own production. The Netherlands shows 31 % demand curtailment and Belgium and Germany cannot cooperate more with The Netherlands due to bottlenecks. Italy shows only 15 % demand curtailment and cannot cooperate with Austria due to an infrastructure limitation between them. The rest of the countries show 26 % demand curtailment.
In Global Ambition scenario, all countries show demand curtailment except for Italy. Serbia, Slovenia, United Kingdom, Luxembourg, Croatia and Ireland show respectively 100 %, 92 %, 69 %, 66 %, 32 % and 46 % demand curtailment. These countries are not connected to hydrogen infrastructure and do not satisfy their demand with their own production. The Netherlands shows 23 % demand curtailment and Belgium and Germany cannot cooperate more with The Netherlands due to infrastructure limitations. The rest of the countries show 15 % to 17 % demand curtailment.
H₂ Infrastructure Level 2
In Distributed Energy scenario, all countries mitigate their demand curtailment due to additional hydrogen production using methane, except for Ireland who fully mitigates its demand curtailment. Serbia, Croatia, Slovenia, and United Kingdom mitigate respectively their demand curtailment to 41 %, 41 %, 29 % and 19 % and the other countries mitigate their demand curtailment to 15 %. Italy mitigates its demand curtailment to 14 %.
In Global Ambition scenario, all countries mitigate their demand curtailment due to additional hydrogen production using methane, except for Ireland and Italy who fully mitigate its demand curtailment. Serbia, Croatia, Slovenia, and United Kingdom mitigate respectively their demand curtailment to 41 %, 40 %, 32 % and 27 % and the other countries mitigate their demand curtailment to 5 % to 7 %. Italy cannot cooperate more with Austria due to a bottleneck.
- 2040
H₂ Infrastructure Level 1
In Distributed Energy scenario, Serbia, Luxembourg and United Kingdom show respectively 100 %, 87 % and 83 %. These countries are not connected to hydrogen infrastructure and do not satisfy their demand with their own production. Most of the countries show 39 % demand curtailment. Eastern countries (Bulgaria, Greece, Slovakia, Croatia, Hungary, Romania) show 35 % demand curtailment and cannot cooperate with neighbouring countries due to infrastructure limitations. Ireland can satisfy its demand with enough hydrogen production.
In Global Ambition scenario, Serbia, Luxembourg, Ireland and United Kingdom show respectively 100 %, 91 %, 69 % and 85 %. These countries are not connected to hydrogen infrastructure and do not satisfy their demand with their own production. The rest of the countries show 54 % demand curtailment.
H₂ Infrastructure Level 2
In Distributed Energy scenario, all countries mitigate their demand curtailment. United Kingdom mitigates its demand curtailment to 32 % and the rest of the countries mitigate their demand curtailment to 28 %. Serbia, Croatia, Slovakia, Hungary and Romania mitigate their demand curtailment to 16 % but cannot cooperate more with other countries due to infrastructure limitations.
In Global Ambition scenario, all countries mitigate their demand curtailment to 38 % except for Ireland who mitigate its demand curtailment to 22 %.
- 2050
H₂ Infrastructure Level 1
In Distributed Energy scenario, Serbia, Luxembourg and United Kingdom show respectively 100 %, 90 % and 57 % demand curtailment. These countries are not connected to hydrogen infrastructure and do not satisfy their demand with their own production. The other countries show 47 % demand curtailment except for Eastern countries (Greece, Slovakia, Bulgaria, Croatia, Hungary, and Romania) who show 32 % demand curtailment and cannot cooperate with other countries due to infrastructure limitations. Portugal shows 32 % demand curtailment and cannot cooperate more with Spain due to infrastructure limitations.
In Global Ambition scenario, Serbia, Luxembourg and United Kingdom show respectively 100 %, 94 % and 68 % demand curtailment. These countries are not connected to hydrogen infrastructure and do not satisfy their demand with their own production. The other countries show 61 % demand curtailment except for in Greece who show 65 % demand curtailment. Bulgaria cannot cooperate more with Greece to mitigate its demand curtailment due to abottleneck between Bulgaria and Greece.
H₂ Infrastructure Level 2
In Distributed Energy scenario, all countries mitigate their demand curtailment. United Kingdom mitigates its demand curtailment to 27 % and the other countries to 24 %. Eastern countries (Greece, Bulgaria, Serbia, Croatia, Slovakia, Hungary, and Romania) mitigate their demand curtailment to 15 % and cannot cooperate more with their neighbouring countries due to infrastructure limitations. Portugal mitigates its demand curtailment to 20 % and cannot cooperate more with Spain due to infrastructure limitation.
In Global Ambition scenario, most of the countries mitigate their demand curtailment to 25 % and 26 %. Spain, Portugal, Italy and France mitigate their demand curtailment to 21 %. They cannot cooperate with interconnected countries due to infrastructure limitations. Ireland mitigates its demand curtailment to 21 %.
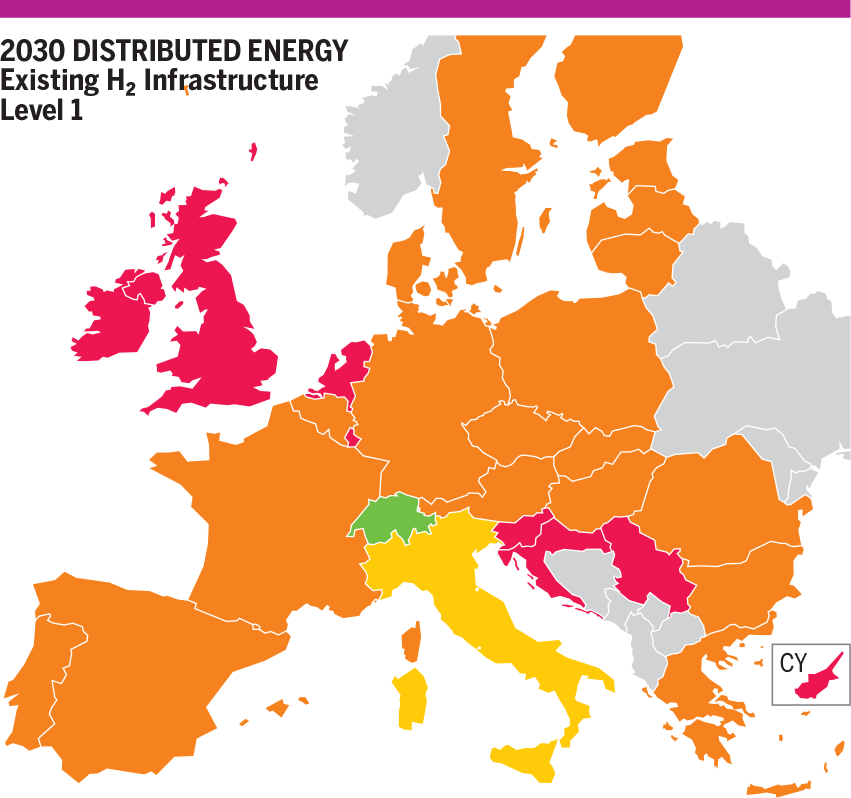
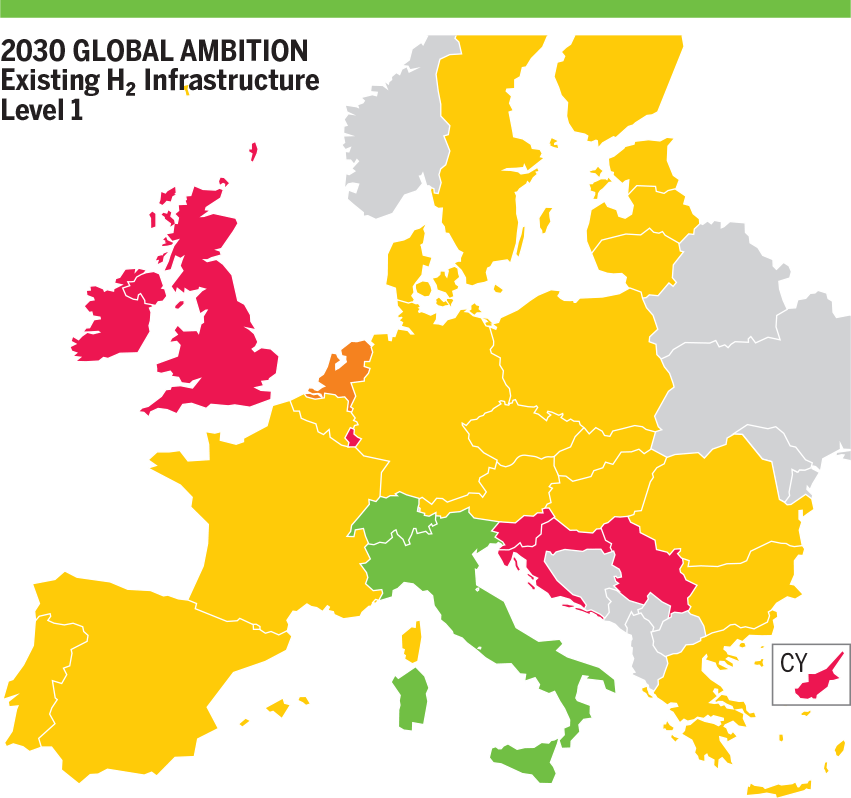
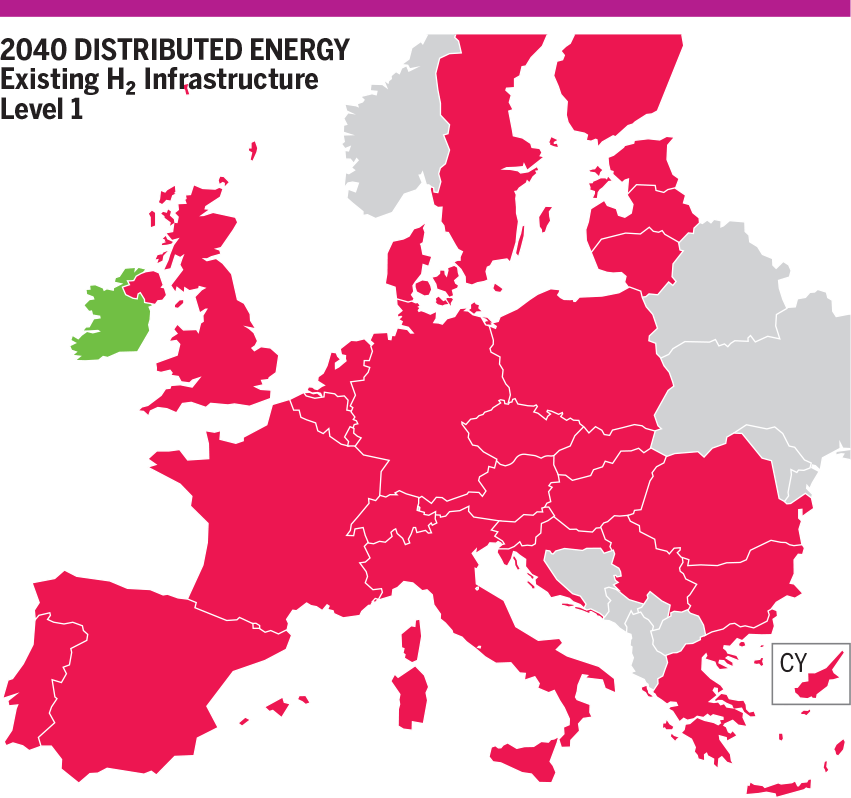


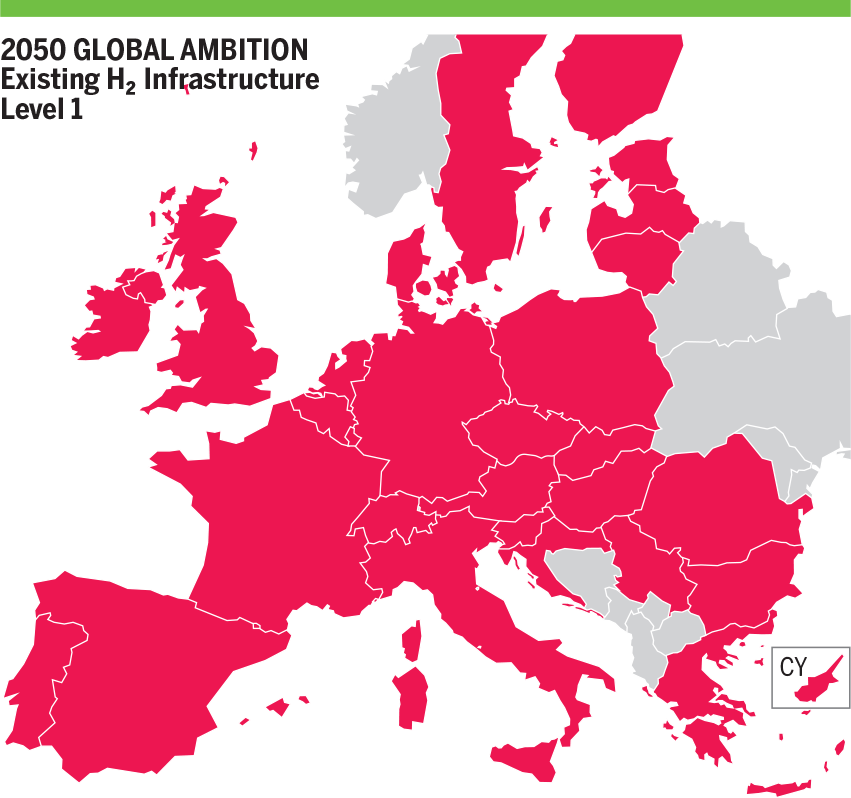

Figure 10.3a: NO H₂ Supply Disruption – Hydrogen Results for 2W Demand in Existing CH₄ Infrastructure and H₂ Level 1
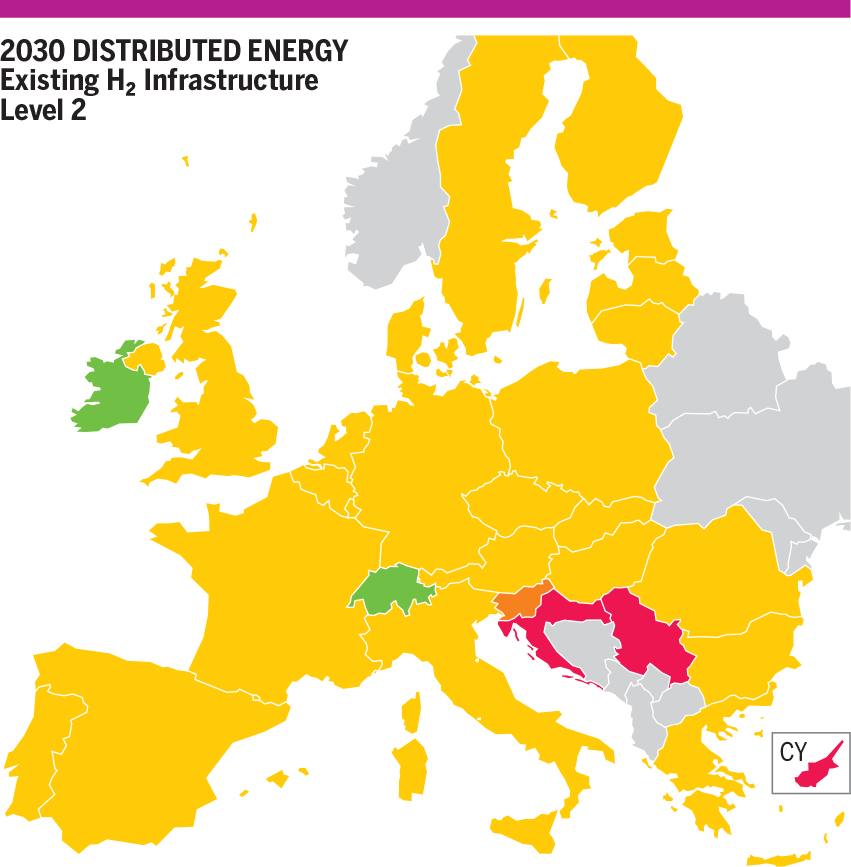
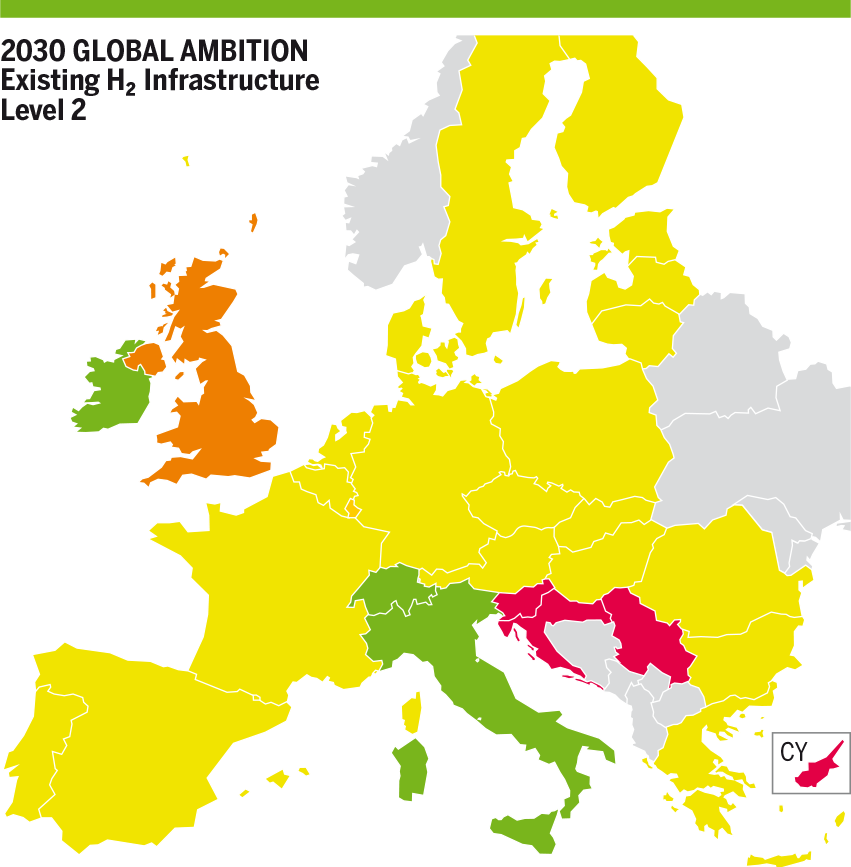
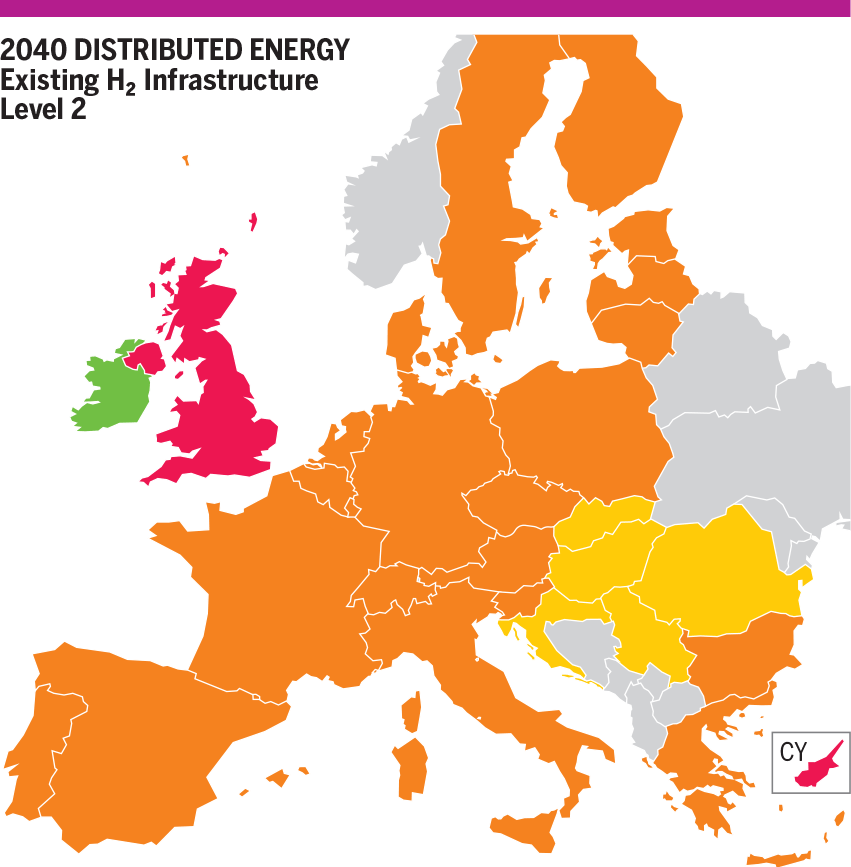
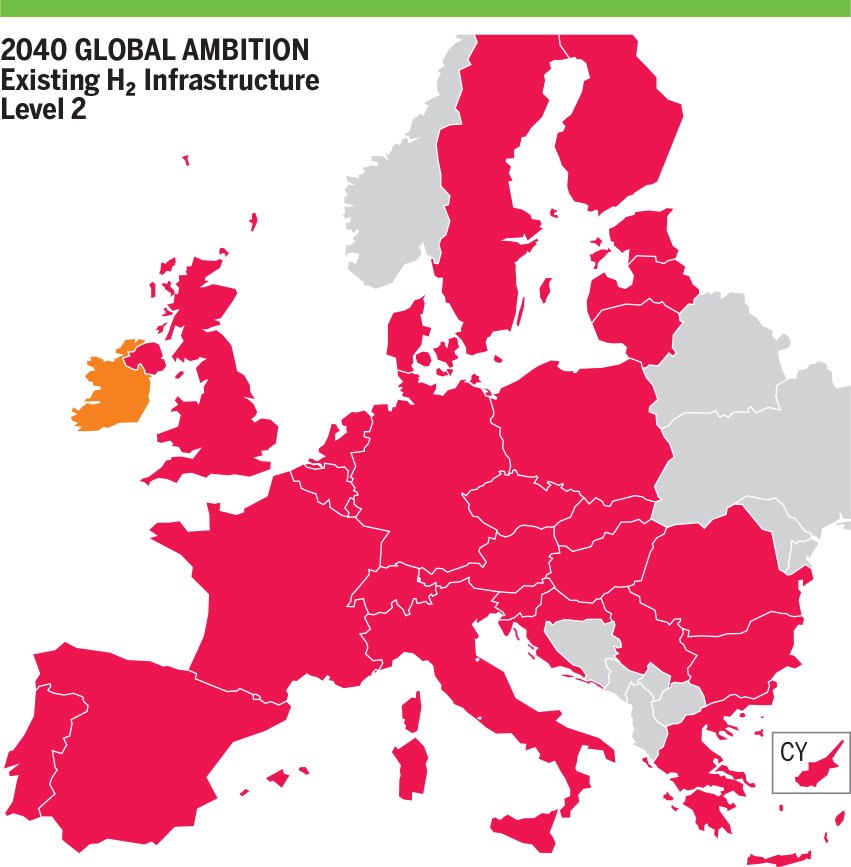
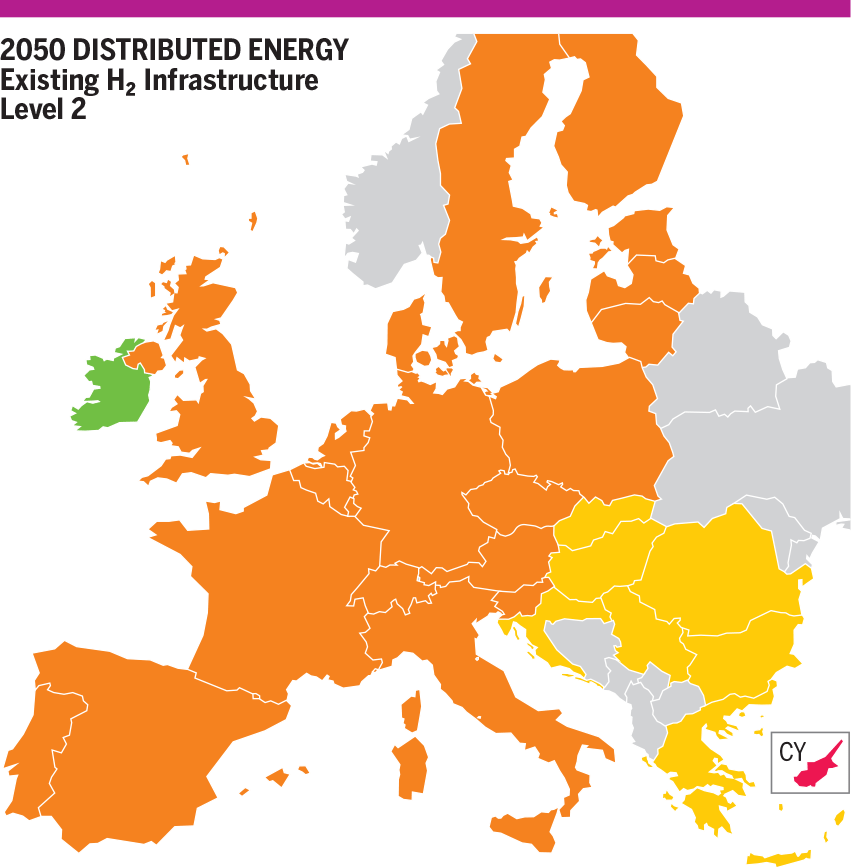
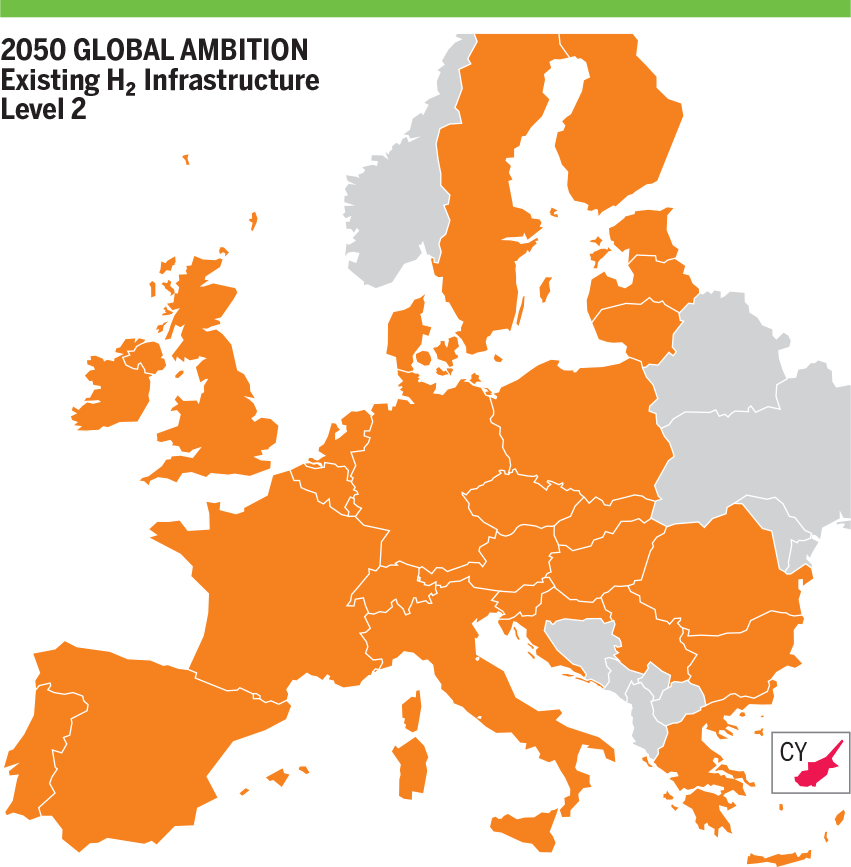

Figure 10.3b: NO H₂ Supply Disruption – Hydrogen Results for 2W Demand in Existing CH₄ Infrastructure and H₂ Level 2
10.2.2.2 Advanced and PCI Infrastructure
Advanced and PCI infrastructure levels show no difference with Existing infrastructure level concerning hydrogen simulation results.
10.3 2-Week Dunkelflaute demand
The 2-Week Dunkelflaute demand is generally very similar to the 2-Week Cold Spell demand. Hydrogen demand is basically the same for Best Estimate and National Trends scenarios and also the same in both Distributed Energy and Global Ambition scenarios for 2030. Regarding Distributed Energy and Global Ambition scenarios in 2040 and 2050, almost all the countries show the same demand values except for Italy, The Netherlands, Romania and United Kingdom.
Regarding the methane demand values, only Bulgaria, Czech Republic, Germany, Croatia and Italy have small demand differences when comparing 2-Week Dunkelflaute with 2-Week Cold in Best Estimate and National trends scenarios.
In Distributed Energy and Global Ambition scenarios just Spain, France, Greece, Italy, The Netherlands, Portugal, Romania and United Kingdom present higher methane demand in 2-Week Dunkelflaute.
As a consequence, the curtailment rate results in 2-Week Dunkelflaute and in 2-Week Cold Spell are exactly the same for most of the countries. The countries with higher demand in 2-Week Dunkelflaute are only increasing their demand curtailment rate in 1 or 2 % maximum.
10.4 Peak demand
10.4.1 Methane Results
10.4.1.1 Existing Methane
In Peak demand, simulations results show that Norwegian Hydrogen supply disruption are similar to Reference case except in Global Ambition scenario in 2030 in Sweden, where the curtailment rate increases from 17 % to 21 % due to a very high methane peak demand.
With less Hydrogen, Sweden is using more methane to produce Hydrogen and create more curtailment on the methane side.
10.4.2 Hydrogen Results
10.4.2.1 Existing Infrastructure
- 2030
H₂ Infrastructure Level 1
In Distributed Energy scenario, most of the countries show 37 % demand curtailment. Countries not interconnected show more curtailment: Serbia (100 %), Slovenia (91 %), Ireland (62 %), United Kingdom (78 %), Luxembourg (74 %) and Croatia (49 %). The Netherlands shows 46 % demand curtailment and Belgium and Germany cannot cooperate more due to infrastructure limitations. Italy, with more supply from North Africa, shows 30 % demand curtailment and cannot cooperate more with Austria due to a bottleneck.
In Global Ambition scenario, situation is similar. Most of the countries show 29 % demand curtailment. Countries not interconnected show more curtailment: Serbia (100 %), Slovenia (94 %), Ireland (62 %), United Kingdom (76 %), Luxembourg (71 %) and Croatia (45 %). The Netherlands shows 41 % demand curtailment and Belgium and Germany interconnected cannot cooperate more due to infrastructure limitations. Italy with more supply from North Africa shows 16 % demand curtailment and cannot cooperate more with Austria due to a bottleneck.
H₂ Infrastructure Level 2
In Distributed Energy scenario, situation is improved for all countries due to more supply and more hydrogen production using methane. Most of the countries show 25 % demand curtailment. Countries not interconnected show more curtailment: Serbia (49 %), Slovenia (42 %), Ireland (25 %), United Kingdom (36 %), Luxembourg (27 %) and Croatia (49 %).
In Global Ambition scenario, situation is improved for all countries due to more supply and more hydrogen production using methane. Most of the countries show 18 % demand curtailment. Countries not interconnected show more curtailment: Serbia (49 %), Slovenia (44 %), Ireland (20 %), United Kingdom (40 %), Luxembourg (29 %) and Croatia (48 %).
- 2040
H₂ Infrastructure Level 1
In Distributed Energy scenario, most of the countries show 48 % demand curtailment. Eastern countries (Greece, Croatia, Romania, Hungary, Bulgaria and Slovakia) show 43 % demand curtailment and cannot cooperate with interconnected countries due to infrastructure limitations. Countries not interconnected show mode demand curtailment: Serbia (100 %), Luxembourg (88 %), United Kingdom (87 %). Ireland with more hydrogen production shows only 14 % demand curtailment.
In Global Ambition scenario, most of the countries show 63 % demand curtailment. Eastern countries (Greece, Croatia, Romania, Hungary, Bulgaria and Slovakia) show 61 % to 62 % demand curtailment and cannot cooperate with interconnected countries due to bottlenecks. Countries not interconnected show mode demand curtailment: Serbia (100 %), Luxembourg (93 %), Ireland (81 %), United Kingdom (90 %).
H₂ Infrastructure Level 2
In Distributed Energy scenario, situation is improved for all countries due to more supply and more hydrogen production using methane. Most of the countries show 31 % demand curtailment. United Kingdom shows 48 % demand curtailment and Belgium and Ireland cannot cooperate more with United Kingdom due to infrastructure limitations. Greece and Bulgaria show 35 % demand curtailment and Romania cannot cooperate with them due to a bottleneck with Bulgaria. Eastern countries (Serbia, Croatia, Slovakia, Hungary, Romania) show 28 % demand curtailment and cannot cooperate more with interconnected countries due to bottlenecks. Ireland with more hydrogen production shows 16 % demand curtailment.
In Global Ambition scenario, situation is improved for all countries due to more supply and more hydrogen production using methane. Most of the countries show 45 % demand curtailment. Ireland and United Kingdom show 52 % demand curtailment. Belgium cannot cooperate with United Kingdom to mitigate demand curtailment due to abottleneck.
- 2050
H₂ Infrastructure Level 1
In Distributed Energy scenario, most of the countries show 54 % demand curtailment. Eastern countries (Greece, Croatia, Romania, Hungary, Bulgaria and Slovakia) show 42 % demand curtailment and cannot cooperate with interconnected countries due to infrastructure limitations. Countries not interconnected show mode demand curtailment: Serbia (100 %), Luxembourg (91 %), United Kingdom (68 %). Ireland with more hydrogen production shows only 8 % demand curtailment. Eastern countries (Greece, Croatia, Hungary, Bulgaria, Slovakia and Romania) show 42 % demand curtailment cannot cooperate more with interconnected countries due to infrastructure limitations. Portugal with more hydrogen production shows 40 % demand curtailment and cannot cooperate more with Spain due to a bottleneck.
In Global Ambition scenario, most of the countries show 68 % demand curtailment. Countries not interconnected show mode demand curtailment: Serbia (100 %), Luxembourg (95 %), Ireland (69 %), United Kingdom (79 %).
H₂ Infrastructure Level 2
In Distributed Energy scenario, situation is improved for all countries due to more supply and more hydrogen production using methane. Most of the countries show 27 % to 29 % demand curtailment. United Kingdom shows 44 % demand curtailment and Belgium and Ireland cannot cooperate more with United Kingdom due to bottlenecks. Ireland with more hydrogen production shows 22 % demand curtailment.
In Global Ambition scenario, situation is improved for all countries due to more supply and more hydrogen production using methane. Most of the countries show 35 % demand curtailment. Ireland and United Kingdom show 46 % demand curtailment. Belgium cannot cooperate with United Kingdom to mitigate demand curtailment due to a bottleneck. France, Spain and Portugal show 32 % demand curtailment and cannot cooperate with interconnected countries to mitigate their demand curtailment due to infrastructure limitations.
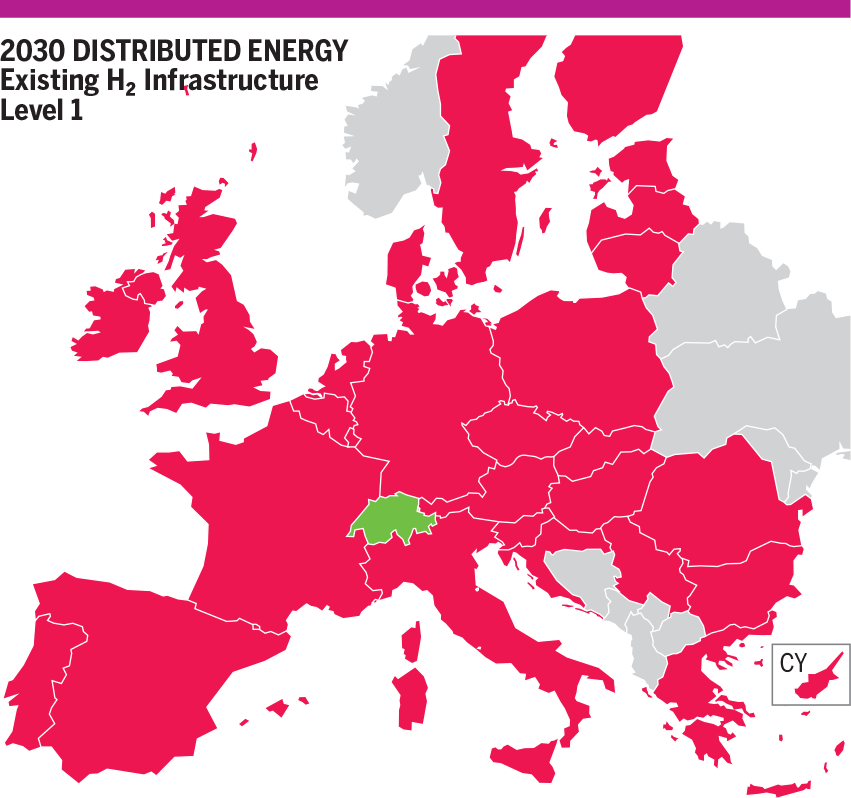
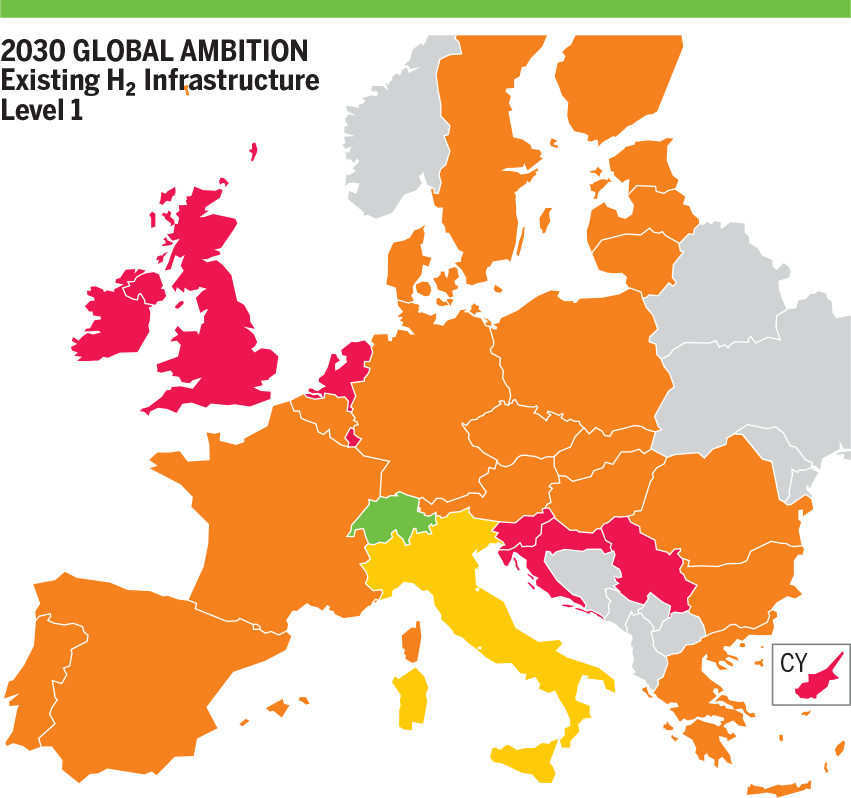
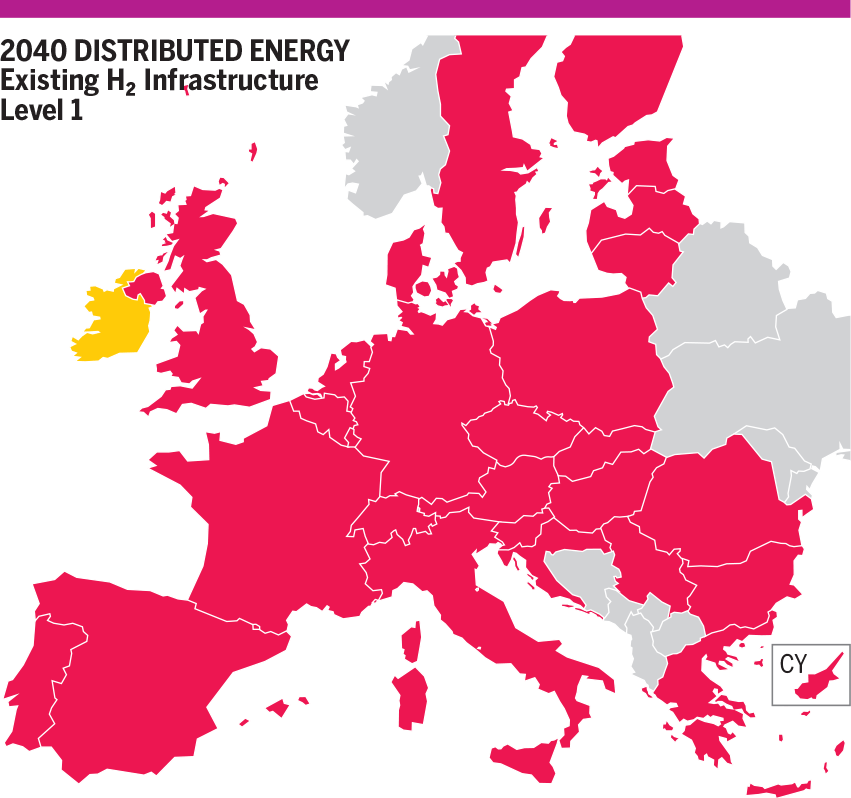

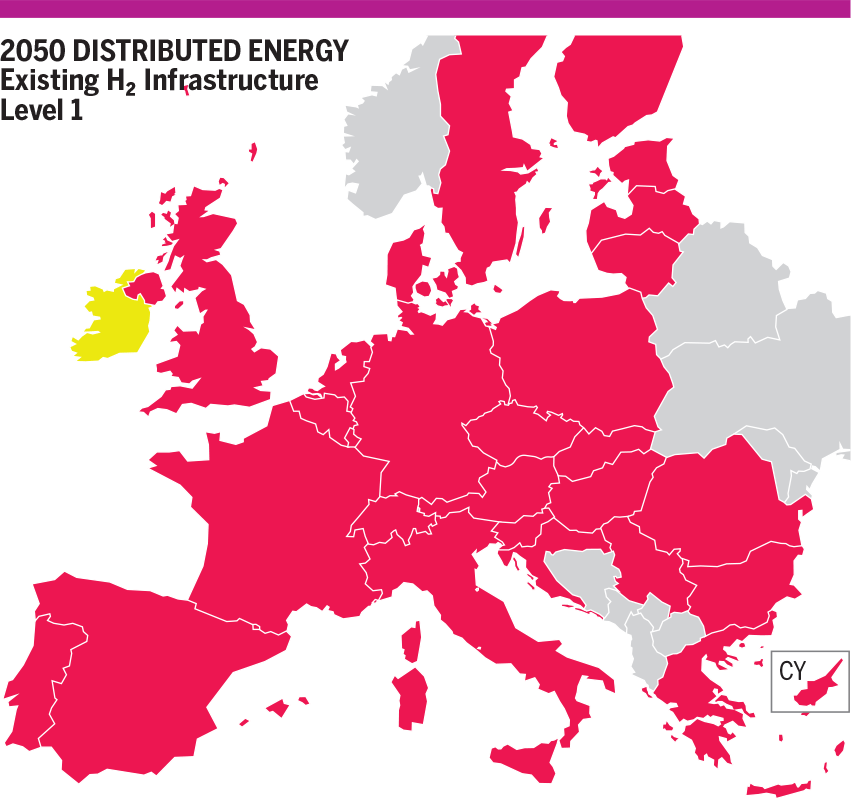


Figure 10.4a: NO H₂ Supply Disruption – Hydrogen Results for Peak Demand in Existing CH₄ Infrastructure and H₂ Level 1
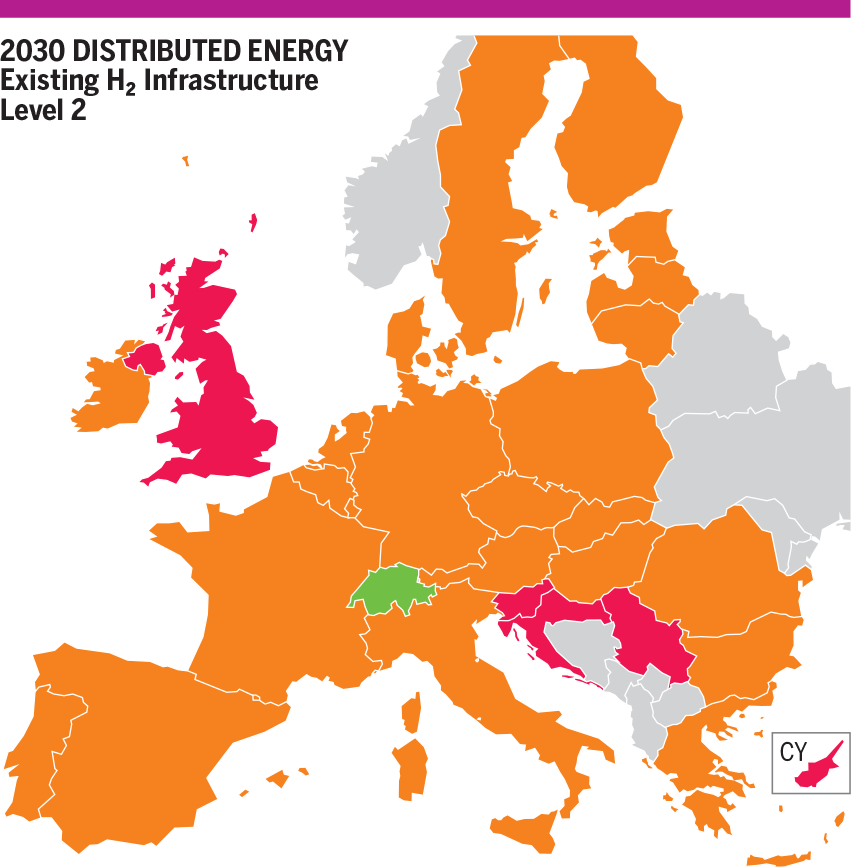
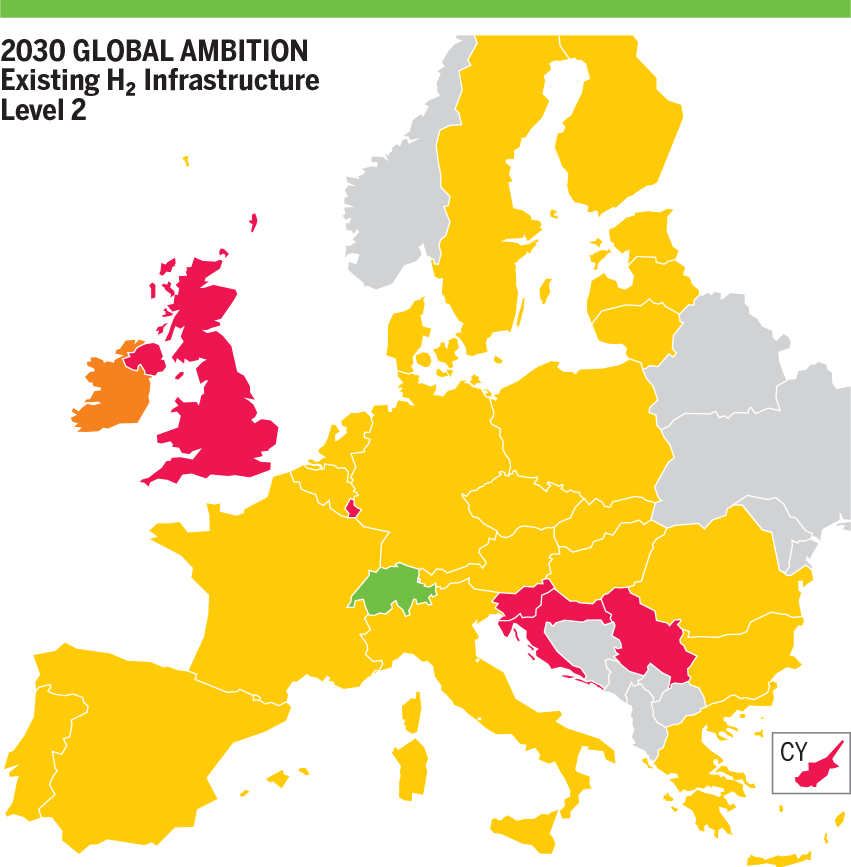
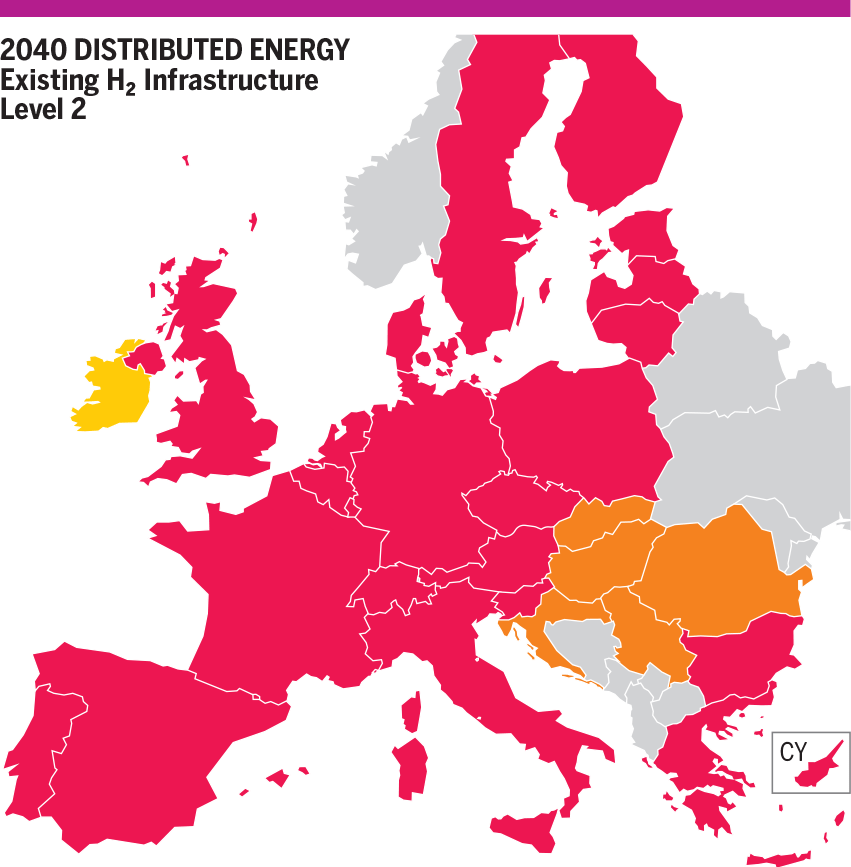

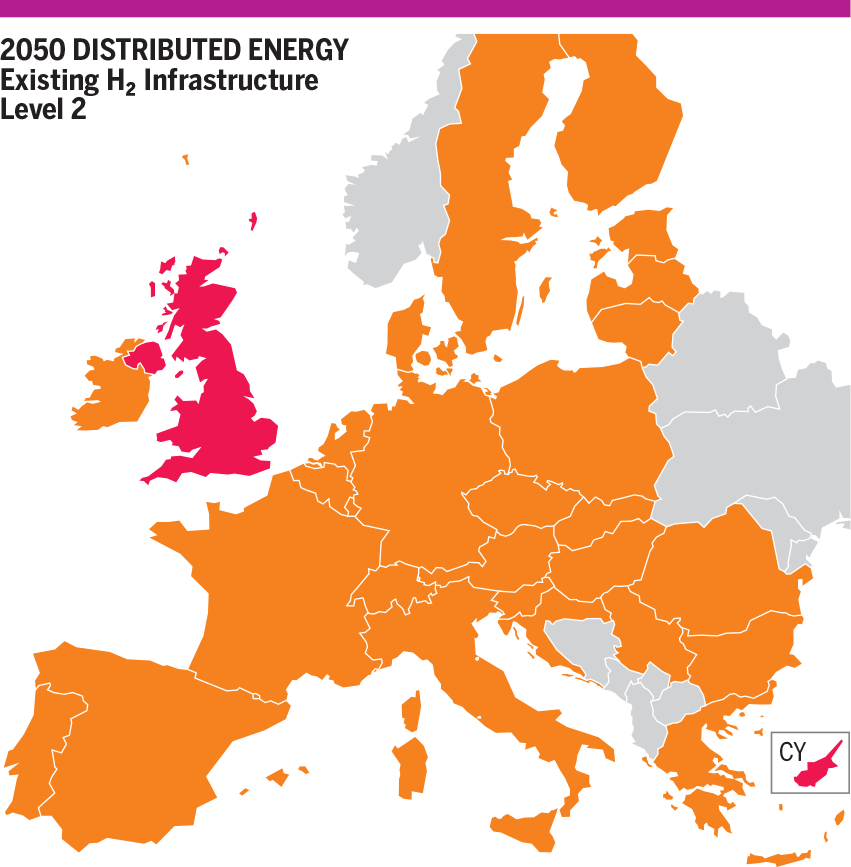
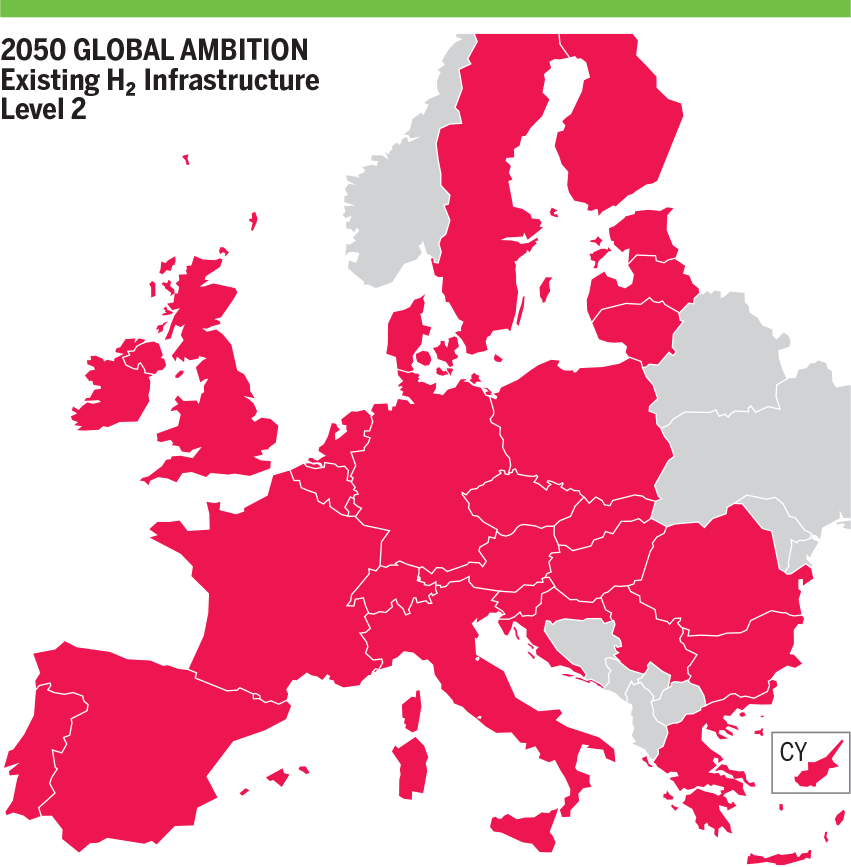

Figure 10.4b: NO H₂ Supply Disruption – Hydrogen Results for Peak Demand in Existing CH₄ Infrastructure and H₂ Level 2
10.4.2.2 Advanced and PCI Hydrogen
Advanced and PCI infrastructure levels show no difference with Existing infrastructure level concerning hydrogen simulation results.