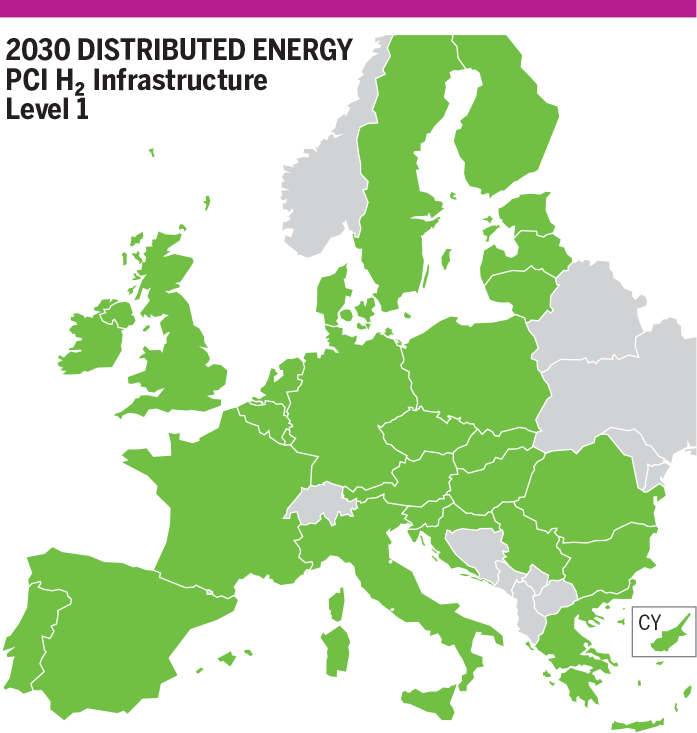
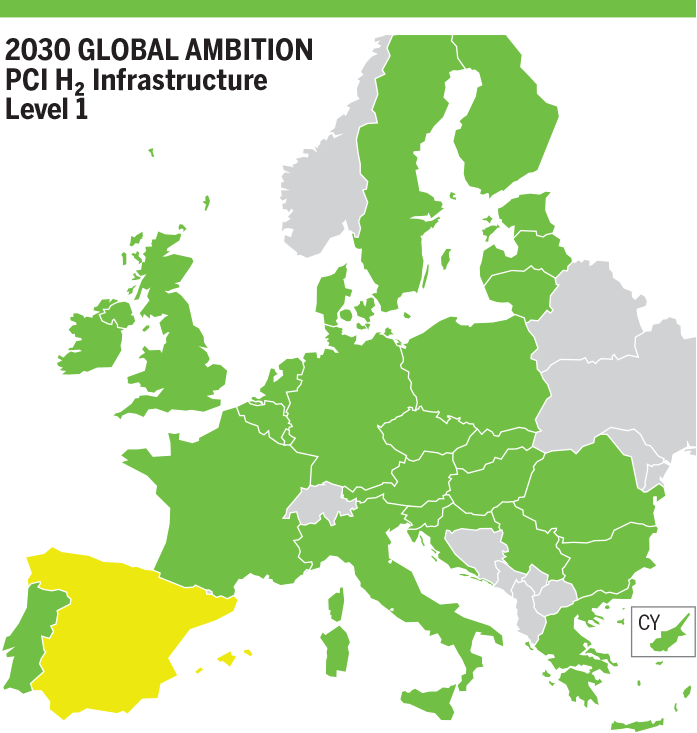
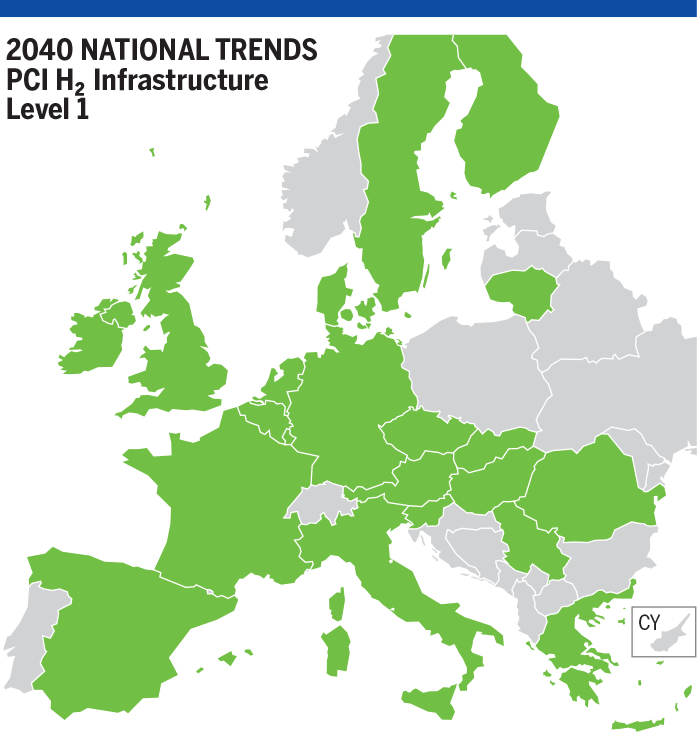
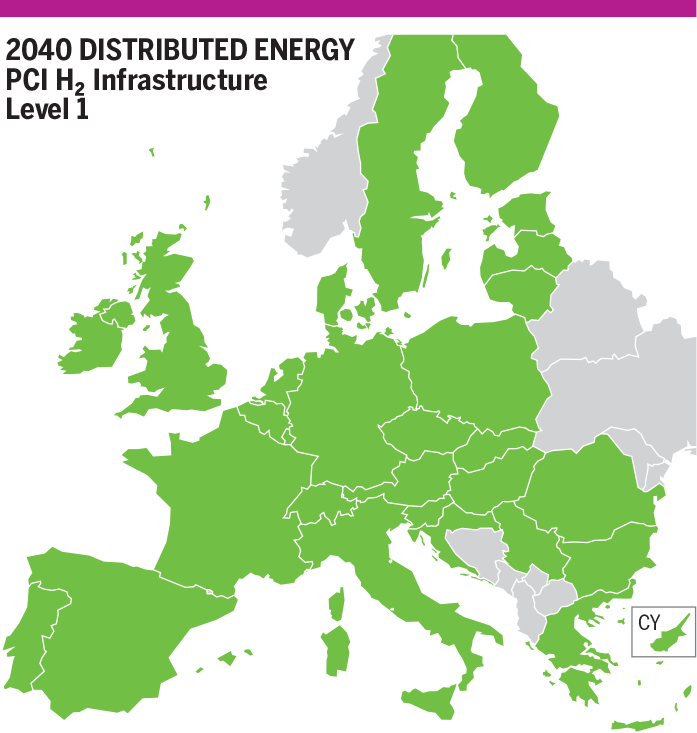
Picture courtesy of Moldovatransgaz
13 Single Largest Infrastructure Disruption (SLID) – Methane
This section investigates the impact of the Single Largest Infrastructure Disruption (SLID) of a country during a Peak day. The SLID measures the curtailed demand following the disruption of this infrastructure in a given country (excluding storage and national production). For each country, the Single Largest Infrastructure depends on the year and the infrastructure level.
The table with the Single Largest Infrastructure considered for each country can be found in Annex D. The results presented correspond to the possible additional curtailment for a country in case of disruption of its Single Largest Infrastructure, and its impact on other countries, compared to the climatic stress in peak day.
The demand curtailment in Peak Day without any disruption is not represented in this chapter (see Climatic Stress chapter).
13.1 Existing Infrastructure (Methane Results)
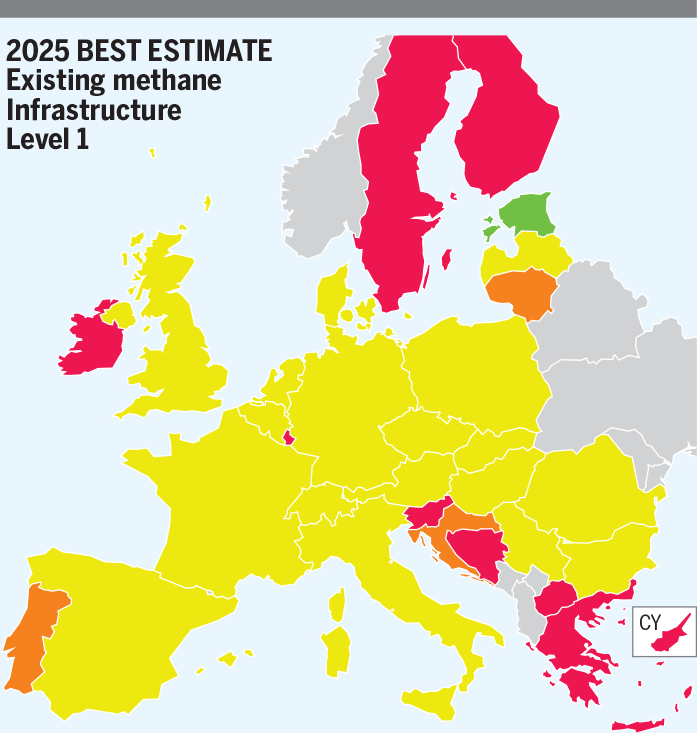
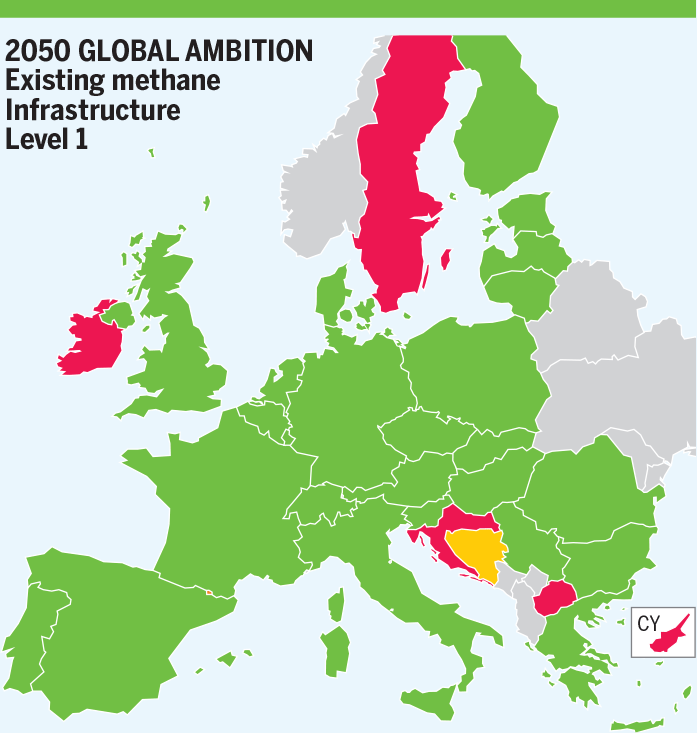
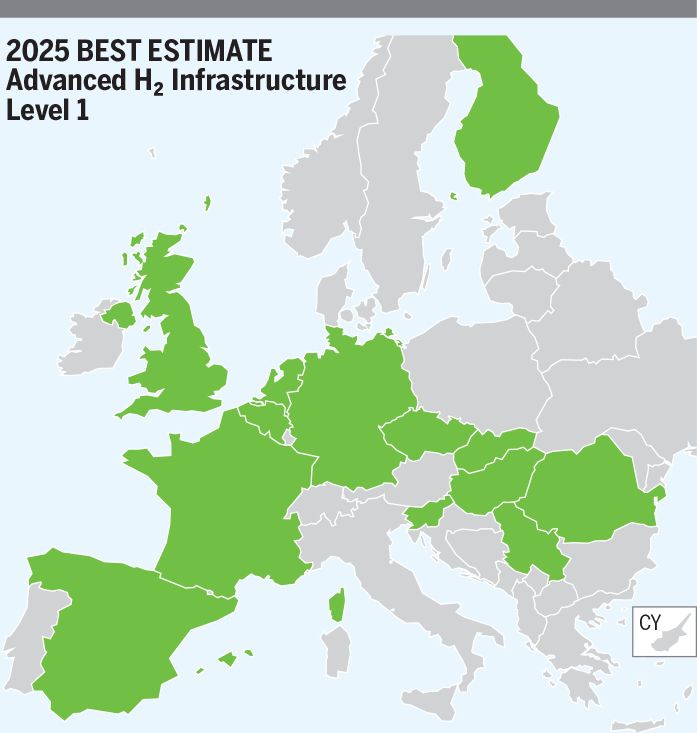
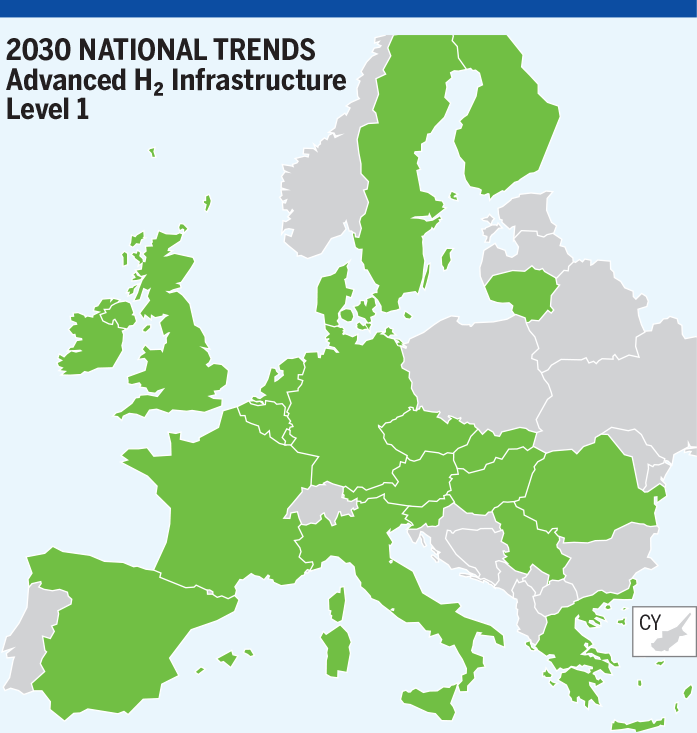
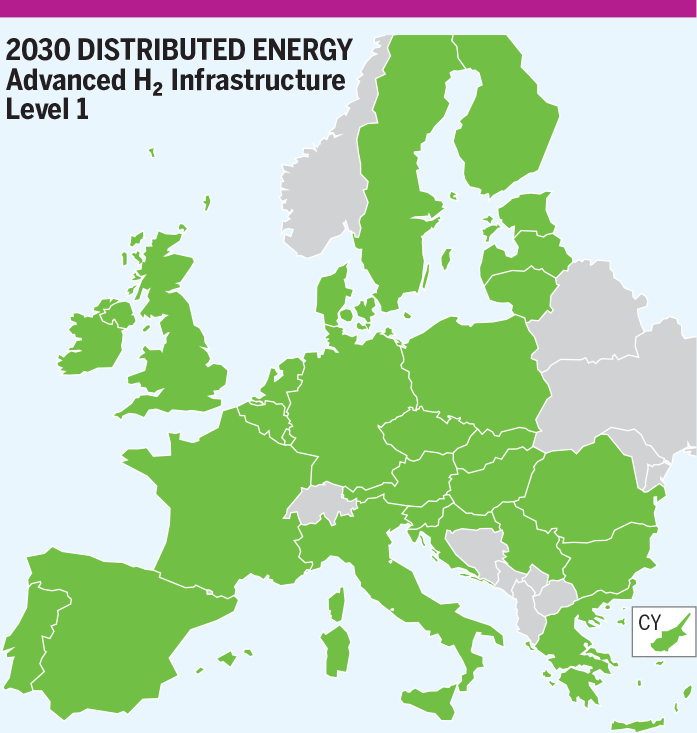
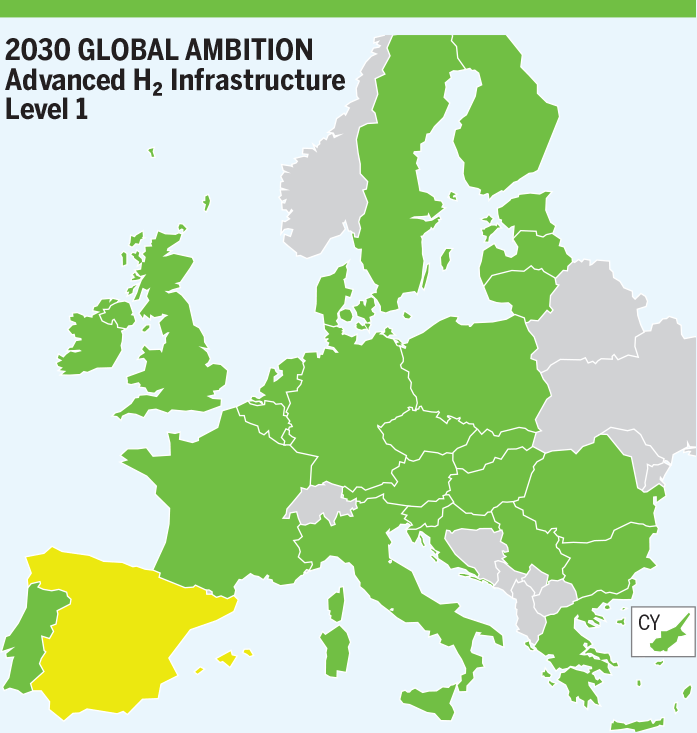
SLID Methane Results in CH₄ Existing Infrastructure – H₂ Infrastructure Level 1
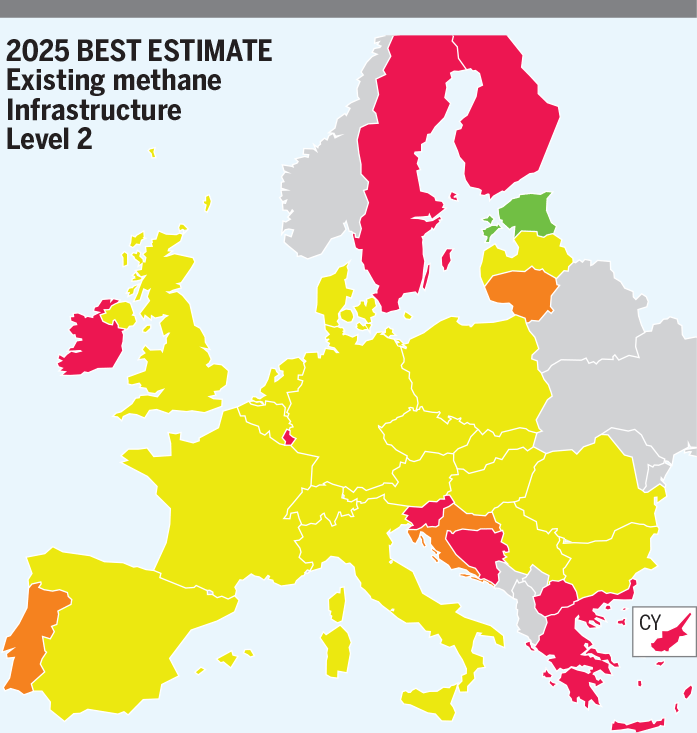
- 2025 – Best estimate
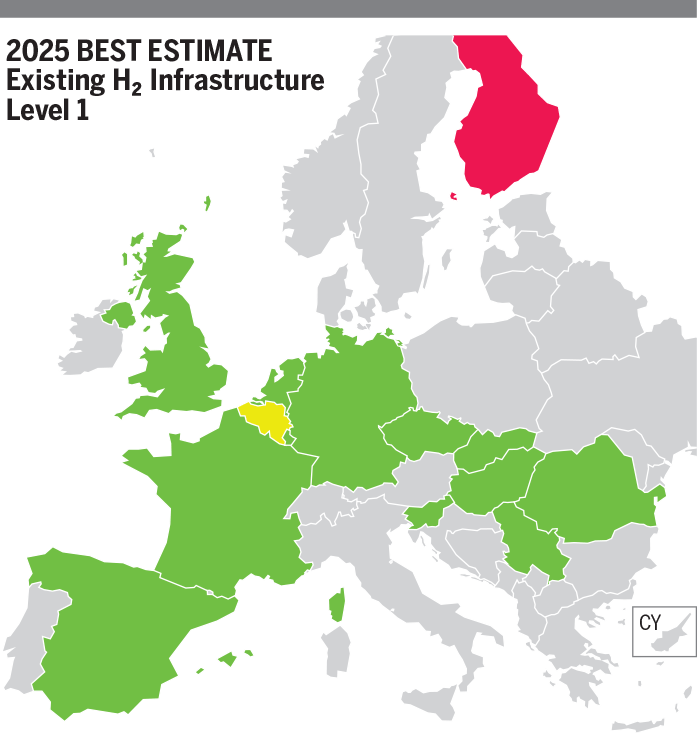
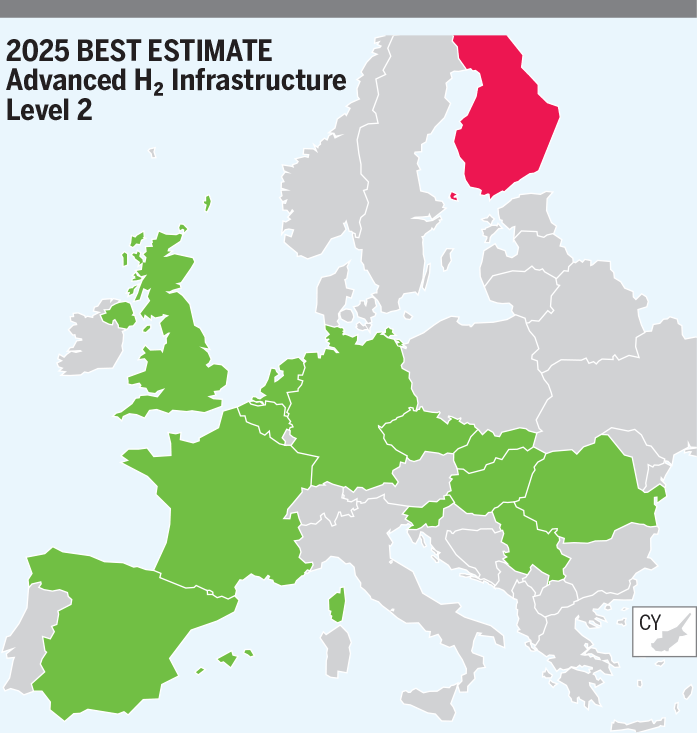
In Best Estimate scenario, the SLID impacts all the countries except for Estonia. SLID is Balticconnector but Estonia has enough interconnection capacity with Latvia. Most of the countries show 2 % to 3 % demand curtailment and good cooperation between them. Countries with low interconnection diversification are the most impacted by SLIDs.
- United Kingdom is exposed to 10 % demand curtailment and Belgium and The Netherlands cannot cooperate more due to infrastructure limitations (bottlenecks).
- Northern Ireland is exposed to 48 % demand curtailment due to SLID Ireland (Moffat), without any other interconnections.
- Ireland is exposed to 79 % demand curtailment due to SLID (Moffat).
- Croatia is exposed to 24 % demand curtailment, SLID corresponds to the Croatia LNG terminal and there are infrastructure limitations with Hungary and Slovenia.
- Bosnia and Herzegovina is exposed to 39 % demand curtailment. Bosnia and Herzegovina has only one interconnection with Serbia which already shows a bottleneck in the Reference Climatic Stress (Peak demand).
- Greece is exposed to 50 % demand curtailment, SLID corresponds to Agia Triada terminal and interconnections with Trans Adriatic Pipeline and with Bulgaria are not enough to mitigate Greece demand curtailment.
- Slovenia is exposed to 41 % demand curtailment, SLID corresponds to the interconnection with Austria and the only interconnection left with Italy cannot satisfy the demand.
- North Macedonia is exposed to 91 % demand curtailment, SLID is the interconnection with Greece and there are no other options to meet its demand.
- Portugal shows 24 % demand curtailment, SLID corresponds to the interconnection with Sines terminal and there are infrastructure limitations with Spain.
- Lithuania shows 28 % demand curtailment, SLID corresponds to the interconnection with Klaipėda LNG terminal and there are bottlenecks with Poland and Latvia.
- Finland shows 34 % demand curtailment, SLID corresponds to the import capacity and without enough interconnections, Finland cannot satisfy its demand.
- Luxembourg is exposed to 49 % demand curtailment, SLID corresponds to Belgium interconnection and the one with Germany shows infrastructure limitations.
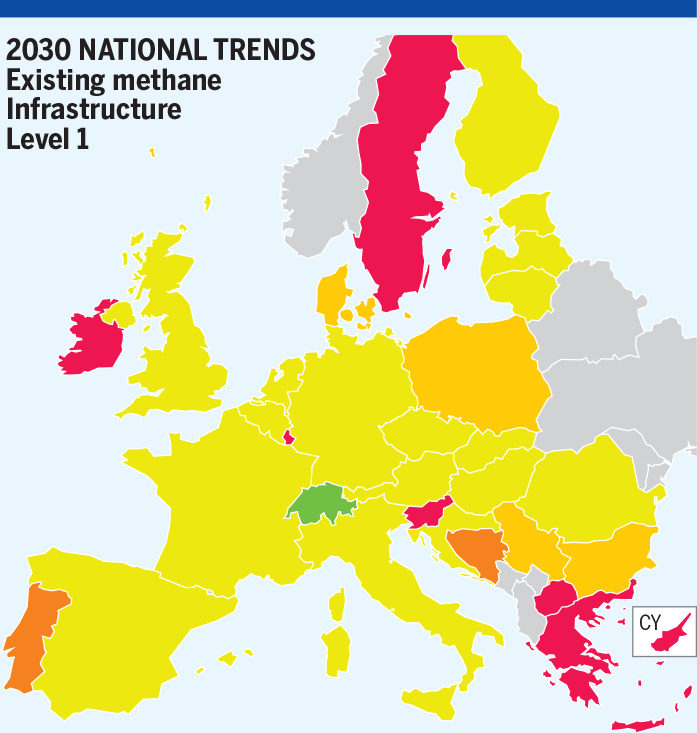
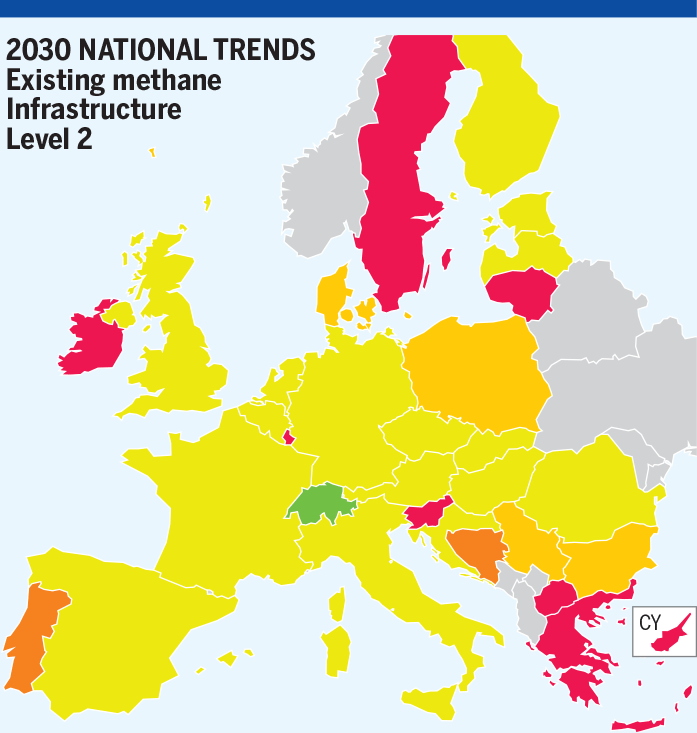
- 2030
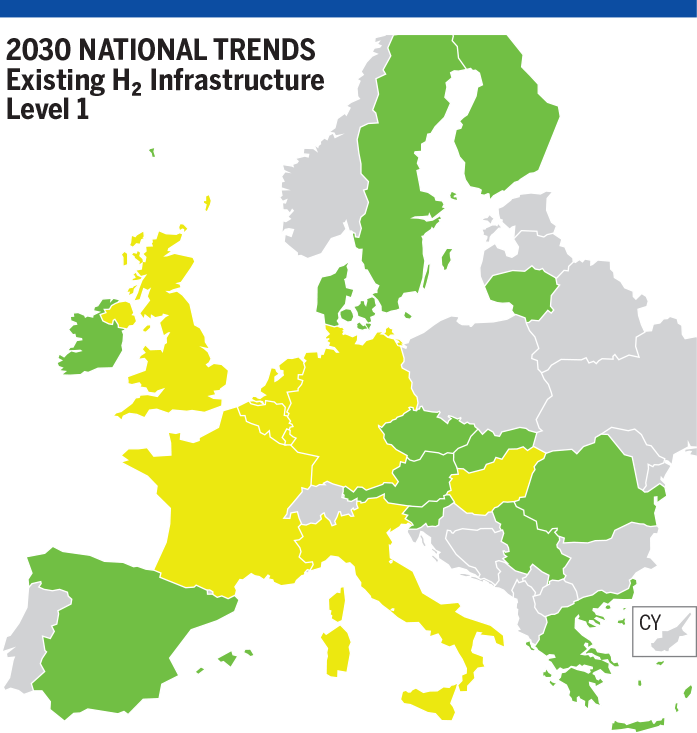
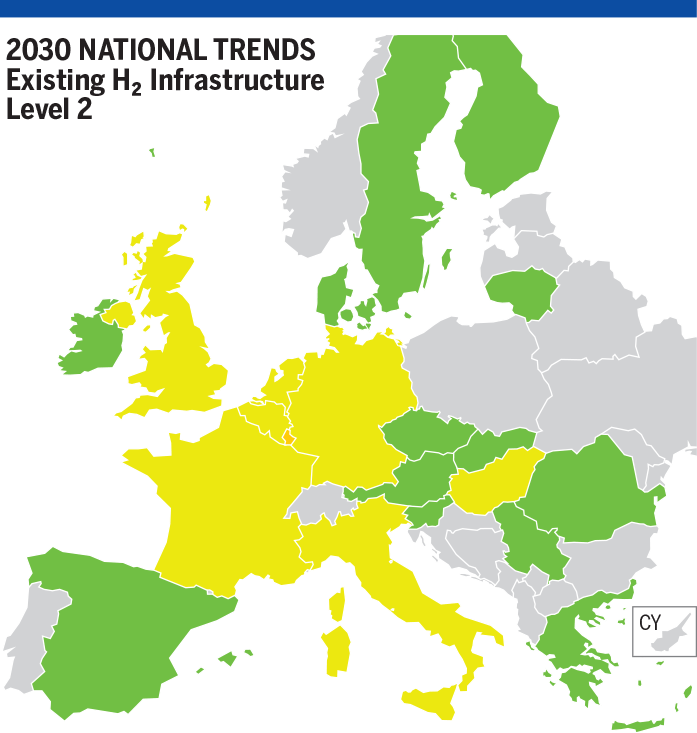
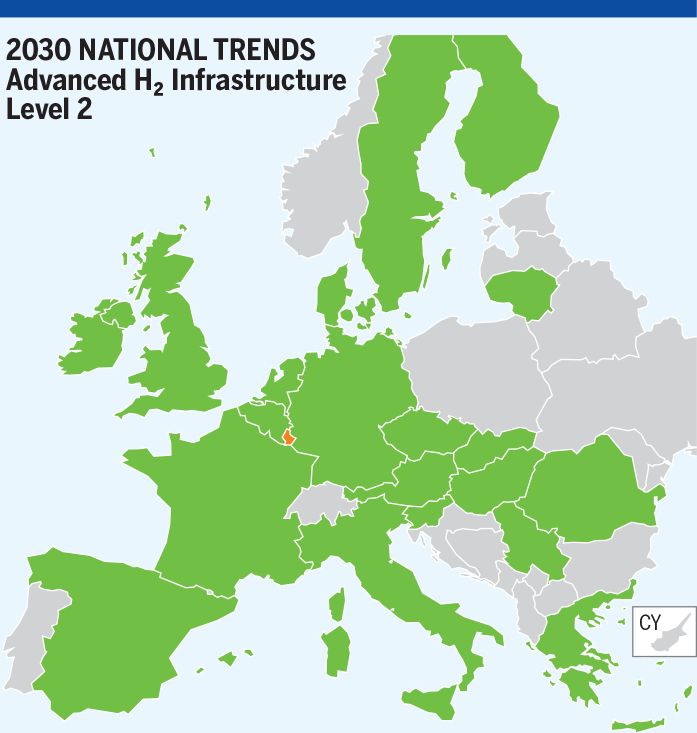
In National Trends scenario, all countries show demand curtailment except for Switzerland. Due to a large diversification, Switzerland can satisfy its demand. Most of the countries show 3 % to 8 % demand curtailment. See below detail comments for countries with more than 10 % demand curtailment
- Serbia is exposed to 13 % demand curtailment with their SLID Kireeva-Zaychar interconnection and there are infrastructure limitations with Hungary.
- Bulgaria is exposed to 13 % demand curtailment, SLID is Turkstream interconnection and interconnections with Serbia, Romania and Greece cannot mitigate Bulgarian demand curtailment.
- Poland is exposed to 15 % demand curtailment, SLID is Baltic pipe and other interconnections cannot mitigate Poland demand curtailment.
- Denmark is exposed to 16 % demand curtailment, SLID is North Sea Entry interconnection (imports from Norway) and other interconnections with Poland or Germany cannot mitigate Denmark demand curtailment.
- Bosnia and Herzegovina is exposed to 21 % demand curtailment, SLID is the interconnection with Serbia and, without any other interconnection, Bosnia and Herzegovina cannot mitigate its demand curtailment.
- Portugal shows 24 % demand curtailment, SLID corresponds to the interconnection with Sines terminal and there is infrastructure limitations (bottleneck) with Spain.
- Lithuania shows 30 % demand curtailment, SLID corresponds to the Klaipėda LNG terminal and there are infrastructure bottlenecks with Poland and Latvia.
- Slovenia is exposed to 47 % demand curtailment, SLID corresponds to the interconnection with Austria and the only interconnection left with Italy cannot satisfy the demand.
- Greece is exposed to 52 % demand curtailment, SLID corresponds to Agia Triada terminal and interconnections with Trans Adriatic Pipeline and with Bulgaria are not enough to mitigate Greece demand curtailment.
- Luxembourg is exposed to 52 % demand curtailment, SLID corresponds to Belgium interconnection and the one with Germany shows infrastructure limitations.
- Northern Ireland is exposed to 68 % demand curtailment due to SLID Ireland (Moffat), without any other interconnections.
- Ireland is exposed to 82 % demand curtailment due to SLID (Moffat).
- North Macedonia is exposed to 96 % demand curtailment, SLID is the interconnection with Greece and there are no other option to meet its demand.
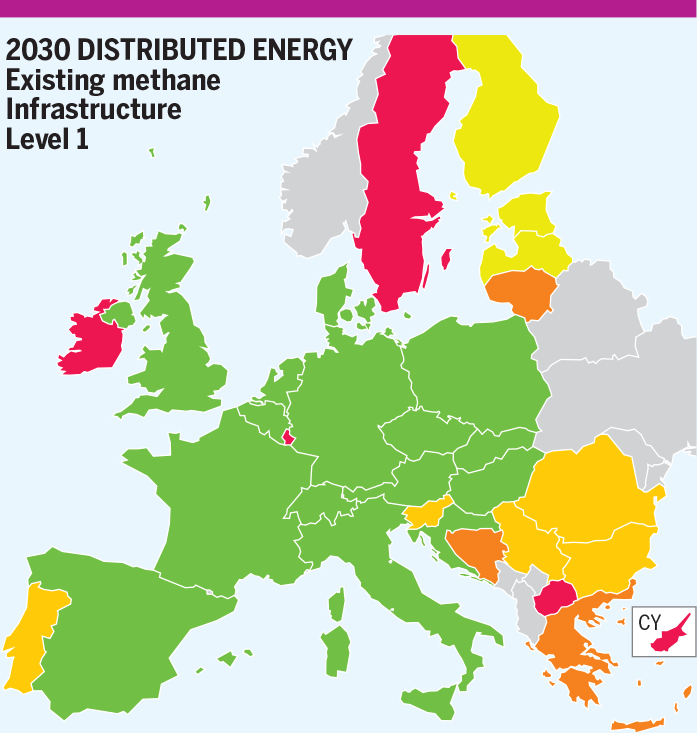
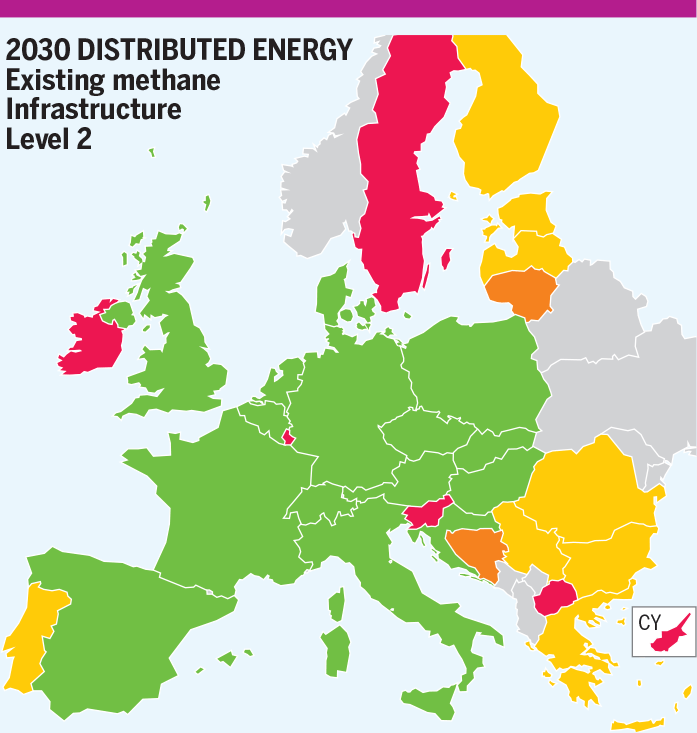
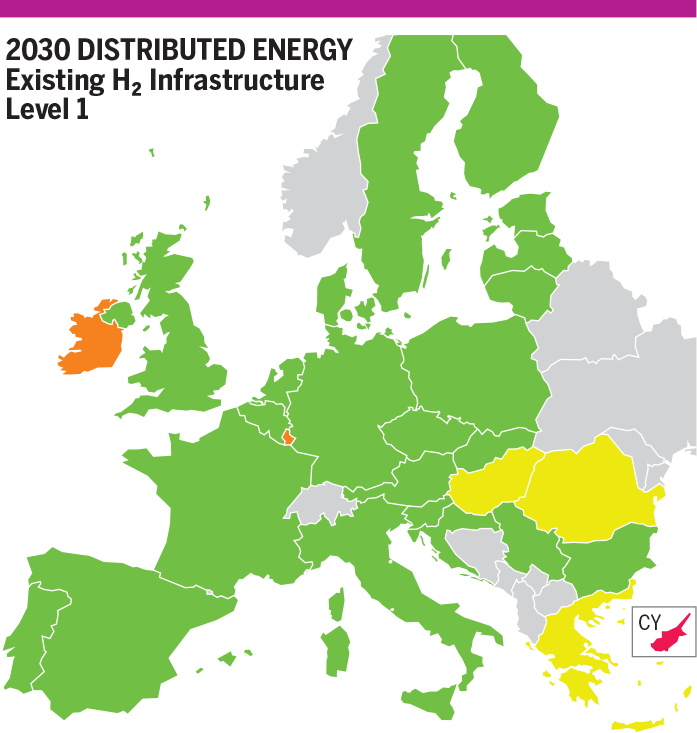
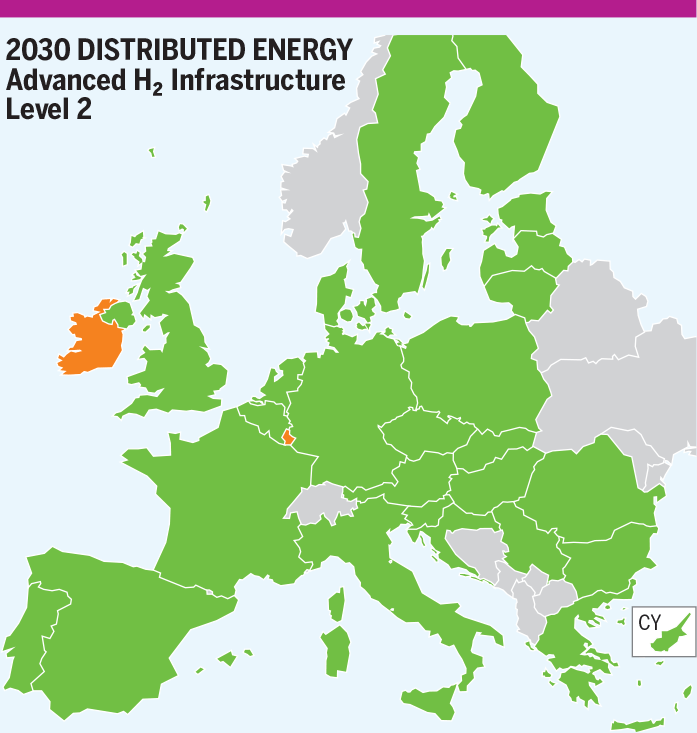
In H₂ Infrastructure level 1, Distributed Energy scenario, most of the countries can satisfy their demand in case of SLIDs.
- Baltic states and Finland show 6 % demand curtailment (26 % for Lithuania) due to infrastructure limitations with Poland and LNG Terminal in Finland and Lithuania.
- Slovenia is exposed to 12 % demand curtailment due infrastructure limitations with Italy and Croatia.
- Serbia, Romania and Bulgaria show 14 % demand curtailment and infrastructure limitations with interconnected countries do not allow them to mitigate demand curtailment.
- Portugal is exposed to 18 % demand curtailment and a bottleneck with Spain does not allow to mitigate the demand curtailment in Portugal.
- Bosnia and Herzegovina is exposed to 21 % demand curtailment, SLID is the interconnection with Serbia and, without any other interconnection, Bosnia and Herzegovina cannot mitigate its demand curtailment.
- Greece is exposed to 24 % demand curtailment, SLID corresponds to Agia Triada terminal and interconnections with Trans Adriatic Pipeline and with Bulgaria are not enough to mitigate Greece demand curtailment.
- Lithuania shows 26 % demand curtailment, SLID corresponds to the Klaipėda LNG terminal and there are infrastructure limitations with Poland and Latvia.
- Luxembourg is exposed to 35 % demand curtailment, SLID corresponds to Belgium interconnection and i the one with Germany shows infrastructure limitations (bottleneck).
- Sweden is exposed to 45 % demand curtailment with the SLID of their only interconnection with Denmark.
- Northern Ireland is exposed to 73 % demand curtailment due to SLID Ireland (Moffat), without any other interconnections.
- Ireland is exposed to 88 % demand curtailment due to SLID (Moffat).
- North Macedonia is exposed to 93 % demand curtailment, SLID is the interconnection with Greece and there are no other options to meet its demand.
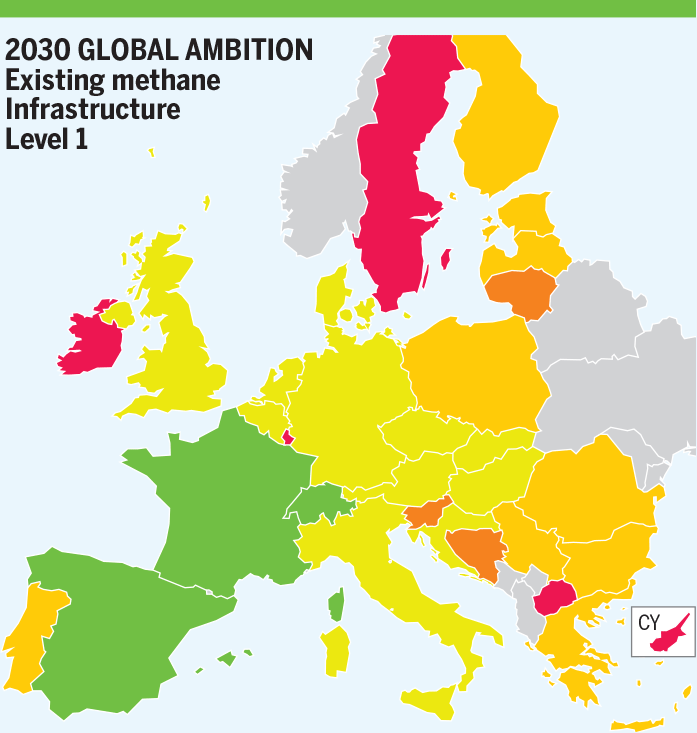
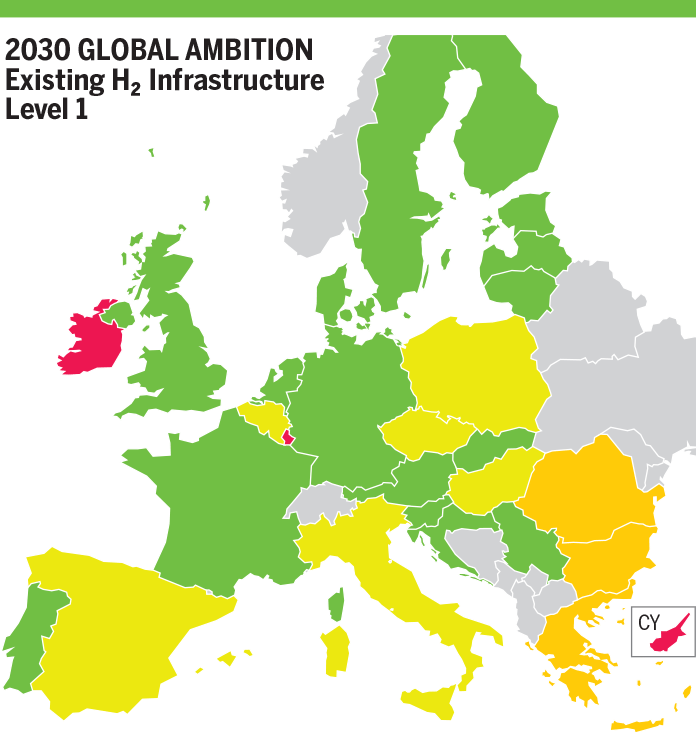
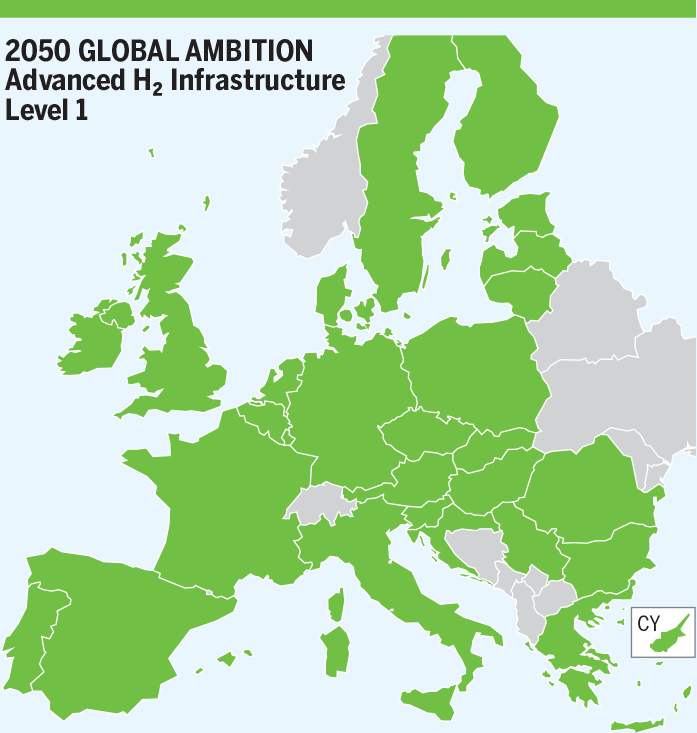
In H₂ Infrastructure level 1 Global Ambition scenario, most of the countries cannot satisfy their demand in case of SLIDs. Only Spain, France and Switzerland are not impacted by SLIDs. Most of the countries show 4 % to 5 % demand curtailment (2 % in Italy).
- Poland is exposed to 10 % demand curtailment, SLID corresponds to Baltic pipe and interconnections with other countries show infrastructure limitations (bottlenecks).
- Romania, Bulgaria and Serbia show 11 % demand curtailment. Due to a good cooperation between these countries, demand curtailment is mitigated and interconnections with Hungary and Greece show bottlenecks.
- Greece shows 18 % demand curtailment and infrastructure limitation with Bulgaria do not allow Bulgaria to mitigate demand curtailment.
- Finland, Estonia and Latvia show 15 % demand curtailment. Due to a good cooperation between these countries, demand curtailment is mitigated and interconnections with neighbouring countries show infrastructure limitations.
- Lithuania shows 25 % demand curtailment, SLID corresponds to the Klaipėda LNG terminal and there are infrastructure limitations with Poland and Latvia.
- Portugal is exposed to 19 % demand curtailment, SLID corresponds to Sines LNG terminal and the infrastructure limitations with Spain do not allow to mitigate the demand curtailment in Portugal.
- Slovenia is exposed to 20 % demand curtailment due infrastructure limitations with Italy and Croatia.
- Bosnia and Herzegovina is exposed to 21 % demand curtailment, SLID is the interconnection with Serbia and, without any other interconnection, Bosnia and Herzegovina cannot mitigate its demand curtailment.
- Luxembourg is exposed to 46 % demand curtailment, SLID corresponds to Belgium interconnection and the one with Germany shows a bottleneck.
- Sweden is exposed to 56 % demand curtailment, SLID is the interconnection with Denmark.
- Northern Ireland is exposed to 65 % demand curtailment due to SLID Ireland (Moffat), without any other interconnections.
- Ireland is exposed to 90 % demand curtailment due to SLID (Moffat).
- North Macedonia is exposed to 82 % demand curtailment, SLID is the interconnection with Greece and there are no other options to meet its demand.
- 2040
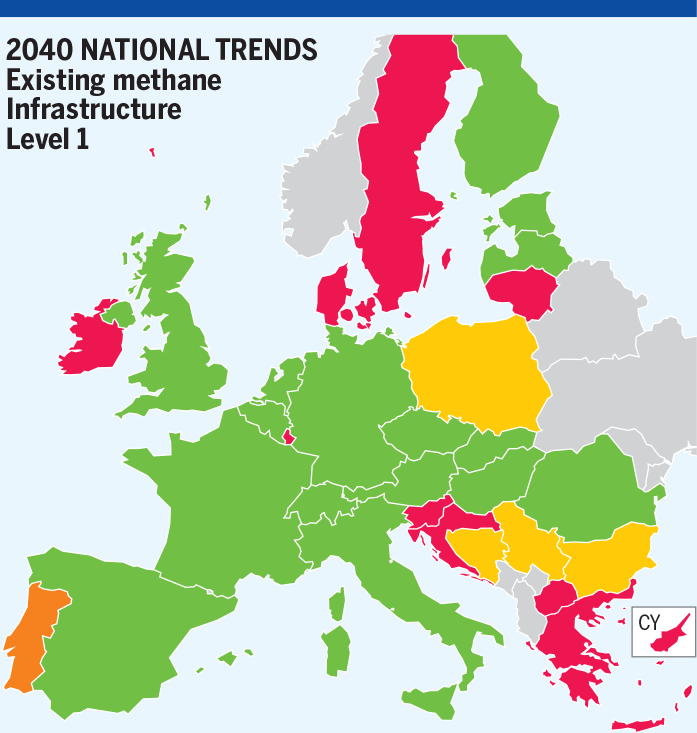
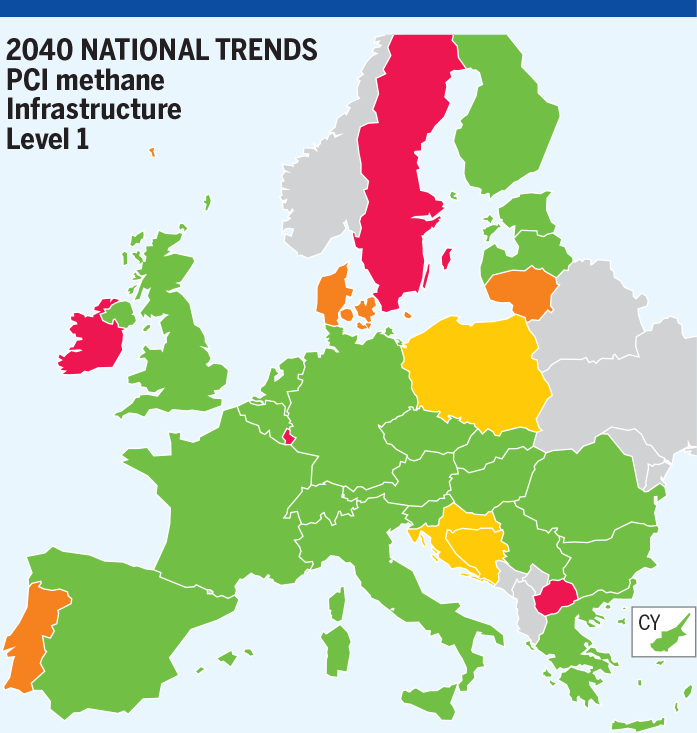
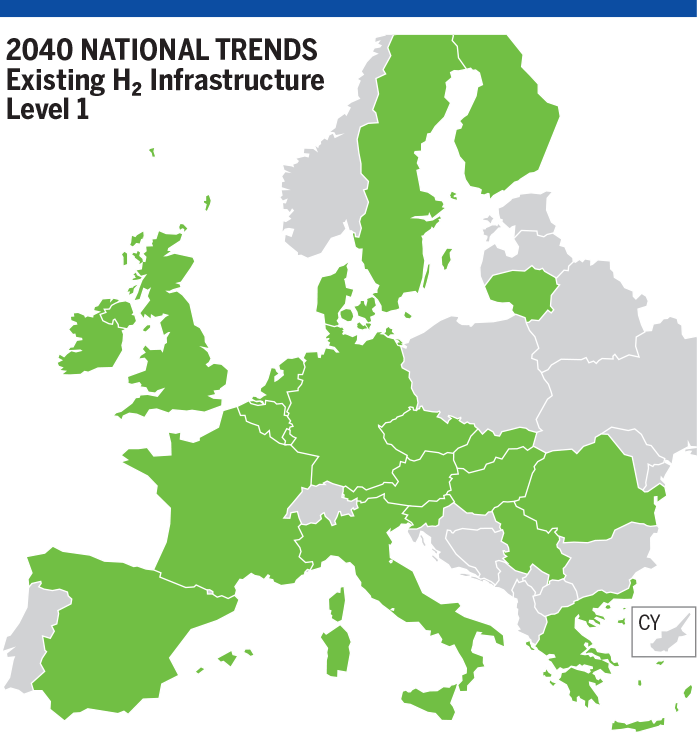
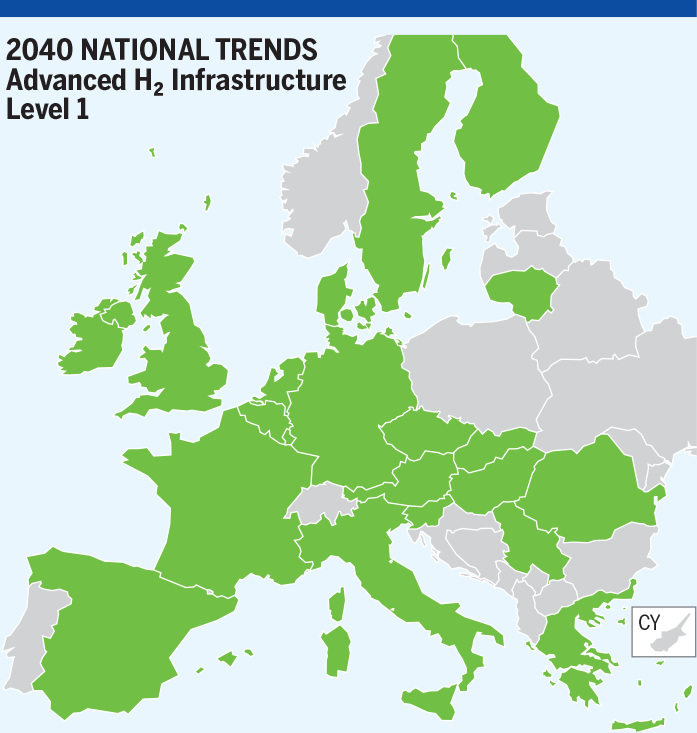
In National Trends scenario, most of countries can satisfy their demand.
- Serbia is exposed to 14 % demand curtailment, SLID is Kireeva-Zaychar interconnection and the interconnection with Hungary shows a bottleneck.
- Bulgaria is exposed to 13 % demand curtailment, SLID is Turkstream and interconnections with Serbia, Romania and Greece cannot mitigate Bulgarian demand curtailment.
- Poland is exposed to 12 % demand curtailment, SLID is Baltic pipe interconnection and other interconnections cannot mitigate Poland demand curtailment.
- Denmark is exposed to 37 % demand curtailment, SLID is North Sea Entry interconnection (imports from Norway) and other interconnections cannot help to mitigate this demand curtailment mostly because of the decreased capacity between Denmark and Germany due to the repurposing of pipelines to hydrogen.
- Bosnia and Herzegovina is exposed to 16 % demand curtailment, SLID is the interconnection with Serbia and, without any other interconnection, Bosnia and Herzegovina cannot mitigate its demand curtailment.
- Portugal shows 22 % demand curtailment, SLID corresponds to the interconnection with Sines terminal and there is a bottleneck with Spain.
- Lithuania shows 31 % demand curtailment, SLID corresponds to the Klaipėda LNG terminal and there are infrastructure limitations with Poland and Latvia.
- Slovenia is exposed to 64 % demand curtailment, SLID corresponds to the interconnection with Austria and the only interconnection left with Italy cannot satisfy the demand.
- Greece is exposed to 40 % demand curtailment, SLID corresponds to Agia Triada terminal and interconnections with Trans Adriatic Pipeline and with Bulgaria are not enough to mitigate Greece demand curtailment.
- Luxembourg is exposed to 58 % demand curtailment, SLID corresponds to Belgium interconnection and interconnection with Germany shows a bottleneck.
- Northern Ireland is exposed to 88 % demand curtailment due to SLID Ireland (Moffat), without any other interconnections.
- Ireland is exposed to 87 % demand curtailment due to SLID (Moffat).
- North Macedonia is exposed to 79 % demand curtailment, SLID is the interconnection with Greece and there are no other options to meet its demand.
- Croatia shows 42 % demand curtailment, SLID is the Croatia LNG terminal and the interconnections with Slovenia and Hungary show infrastructure limitations.
- Sweden shows 83 % demand curtailment, SLID is their only interconnection with Denmark.
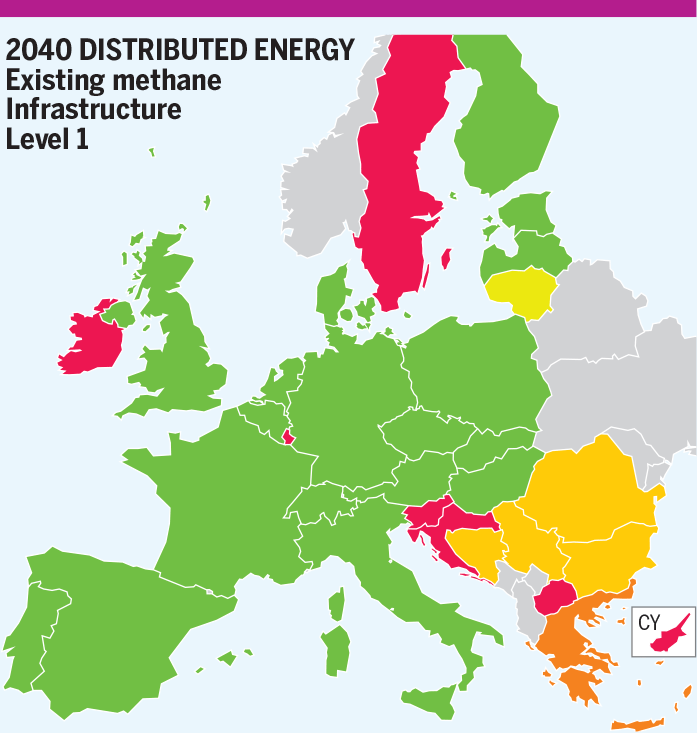
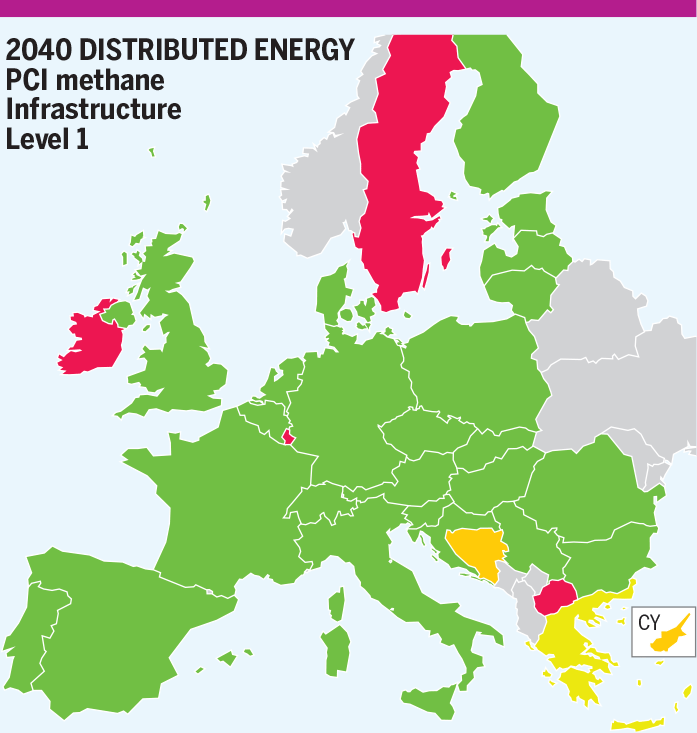
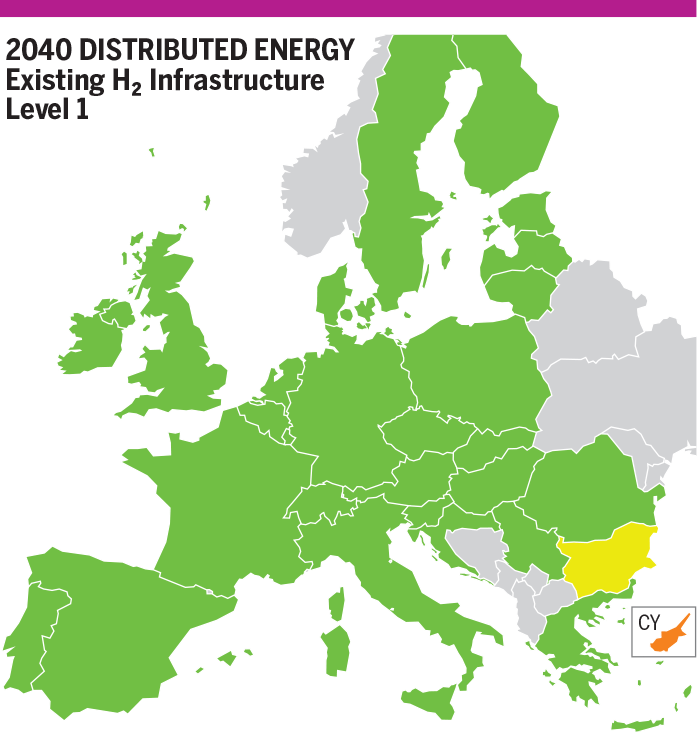
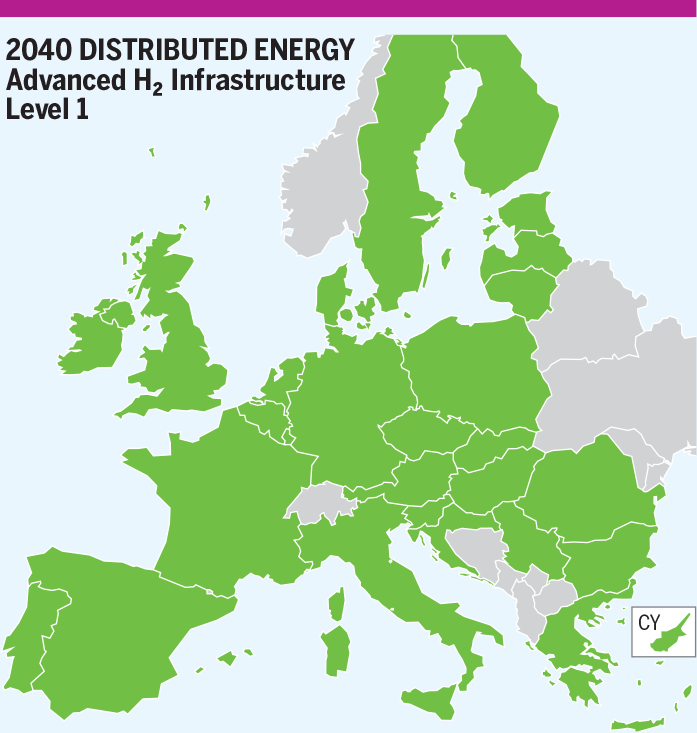
In H₂ Infrastructure Level 1 Distributed Energy scenario, most of the countries are not exposed to demand curtailment, due to the indigenous production and enough interconnection diversification. Despite a high indigenous production in Distributed Energy scenario, some countries do not satisfy their demand.
- Serbia is exposed to 19 % demand curtailment, SLID is Kireeva – Zaychar interconnection and the interconnection with Hungary shows infrastructure limitations.
- Bulgaria is exposed to 19 % demand curtailment, SLID is Turkstream and interconnections with Serbia, Romania and Greece cannot mitigate Bulgarian demand curtailment.
- Bosnia and Herzegovina is exposed to 16 % demand curtailment, SLID is the interconnection with Serbia and, without any other interconnection, Bosnia and Herzegovina cannot mitigate its demand curtailment.
- Lithuania shows 7 % demand curtailment, SLID corresponds to the Klaipėda LNG terminal and there are bottlenecks with Poland and Latvia.
- Slovenia is exposed to 35 % demand curtailment, SLID corresponds to the interconnection with Austria and the only interconnection left with Italy cannot satisfy the demand.
- Greece is exposed to 21 % demand curtailment, SLID corresponds to Agia Triada terminal and interconnections with Trans Adriatic Pipeline and with Bulgaria are not enough to mitigate Greece demand curtailment.
- Luxembourg is exposed to 21 % demand curtailment, SLID corresponds to Belgium interconnection and the one with Germany shows infrastructure limitations.
- Northern Ireland is exposed to 100 % demand curtailment due to SLID Ireland (Moffat), without any other interconnections.
- Ireland is exposed to 87 % demand curtailment due to SLID (Moffat).
- North Macedonia is exposed to 89 % demand curtailment, SLID is the interconnection with Greece and there are no other options to meet its demand.
- Croatia shows 54 % demand curtailment, SLID is the Croatia LNG terminal and the interconnections with Slovenia and Hungary show infrastructure limitations.
- Sweden shows 36 % demand curtailment, SLID is their only interconnection with Denmark.
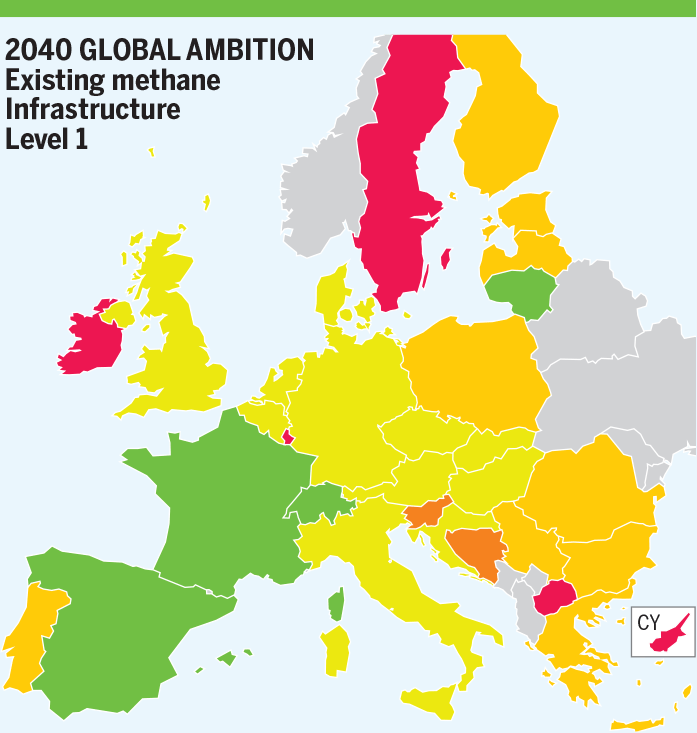
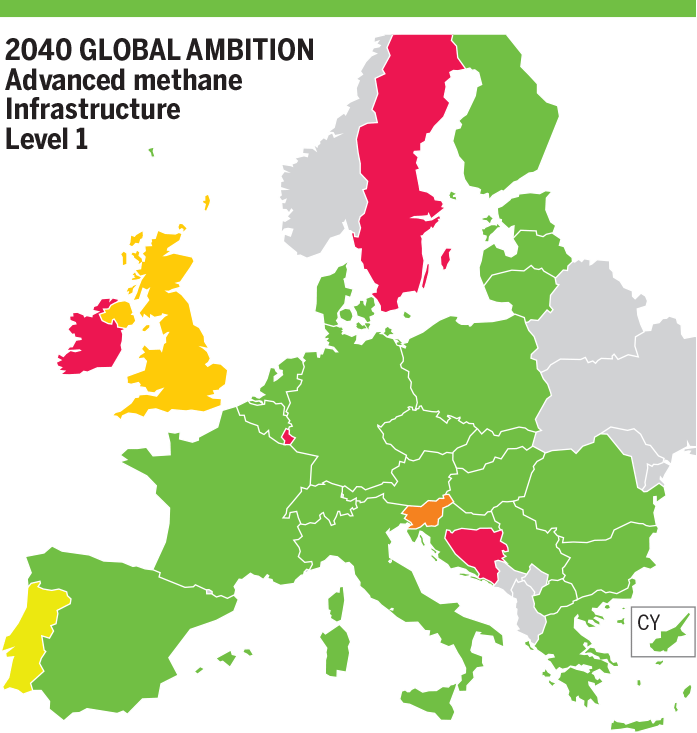
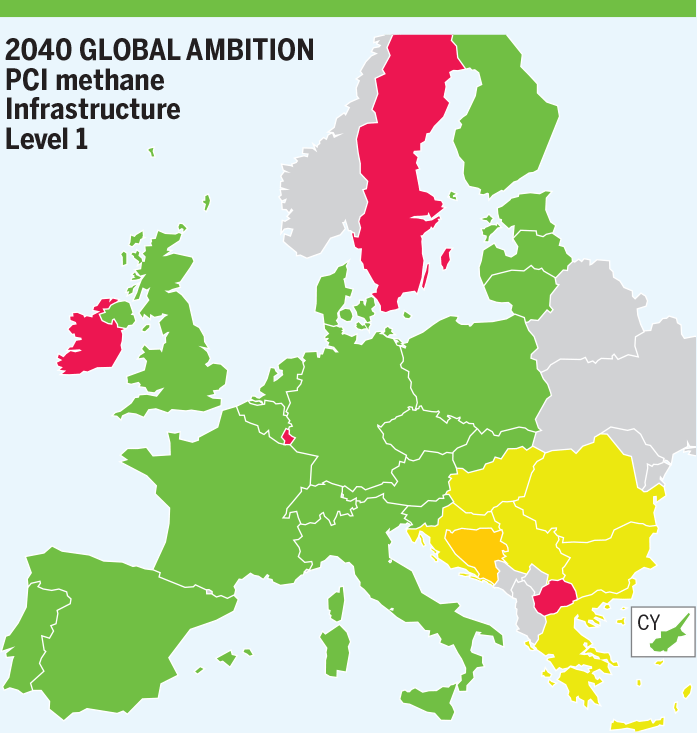
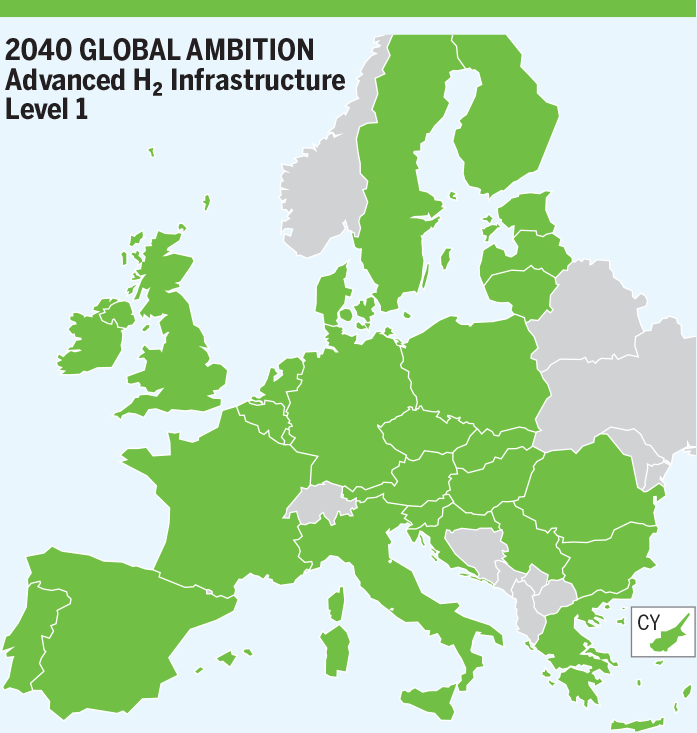
In H₂ Infrastructure Level 1 Global Ambition scenario, most of the countries are not exposed to demand curtailment, due to the indigenous production and enough interconnection diversification. Despite a high indigenous production in Global Ambition scenario, some countries do not satisfy their demand.
- Serbia is exposed to 21 % demand curtailment, SLID is Kireeva-Zaychar interconnection and the interconnection with Hungary shows infrastructure limitations.
- Bulgaria is exposed to 21 % demand curtailment, SLID is Turkstream and interconnections with Serbia, Romania and Greece cannot mitigate Bulgarian demand curtailment.
- Bosnia and Herzegovina is exposed to 16 % demand curtailment, SLID is the interconnection with Serbia and, without any other interconnection, Bosnia and Herzegovina cannot mitigate its demand curtailment.
- Lithuania shows 30 % demand curtailment, SLID corresponds to the Klaipėda LNG terminal and there are infrastructure limitations with Poland and Latvia.
- Slovenia is exposed to 25 % demand curtailment, SLID corresponds to the interconnection with Austria and the only interconnection left with Italy cannot satisfy the demand.
- Greece is exposed to 22 % demand curtailment, SLID corresponds to Agia Triada terminal and interconnections with Trans Adriatic Pipeline and with Bulgaria are not enough to mitigate Greece demand curtailment.
- Luxembourg is exposed to 19 % demand curtailment, SLID corresponds to Belgium interconnection and the one with Germany shows a bottleneck.
- Northern Ireland is exposed to 97 % demand curtailment due to SLID Ireland (Moffat), without any other interconnections.
- Ireland is exposed to 90 % demand curtailment due to SLID (Moffat).
- North Macedonia is exposed to 88 % demand curtailment, SLID is the interconnection with Greece and there are no other options to meet its demand.
- Croatia shows 50 % demand curtailment, SLID is the Croatia LNG terminal and the interconnections with Slovenia and Hungary show infrastructure limitations.
- Sweden shows 36 % demand curtailment, SLID is their only interconnection with Denmark.
- Poland is exposed to 2 % demand curtailment, SLID is Baltic pipe interconnection and the other interconnections cannot mitigate Poland demand curtailment.
- Denmark is exposed to 3 % demand curtailment, SLID is North Sea Entry interconnection (imports from Norway) and the other interconnections with Poland and Germany (with repurposed infrastructure) cannot mitigate Denmark demand curtailment.
- 2050
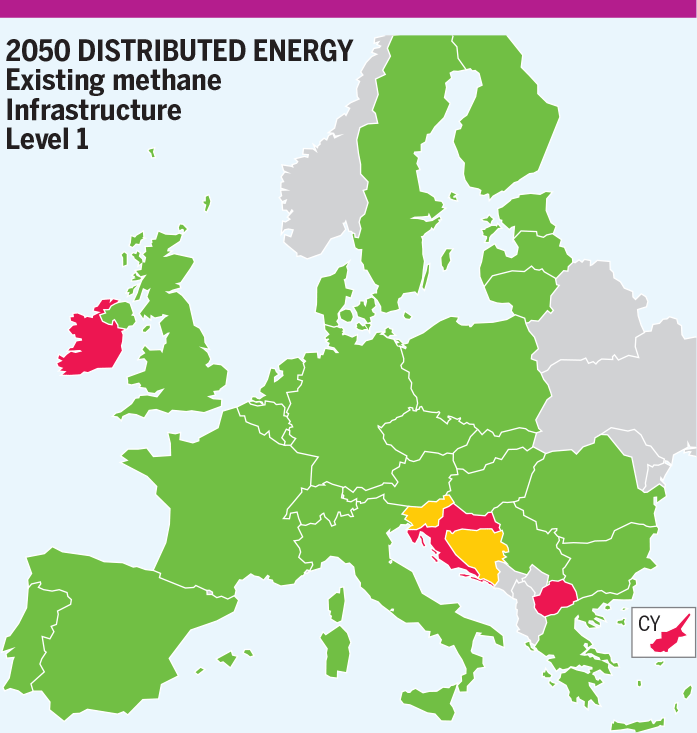
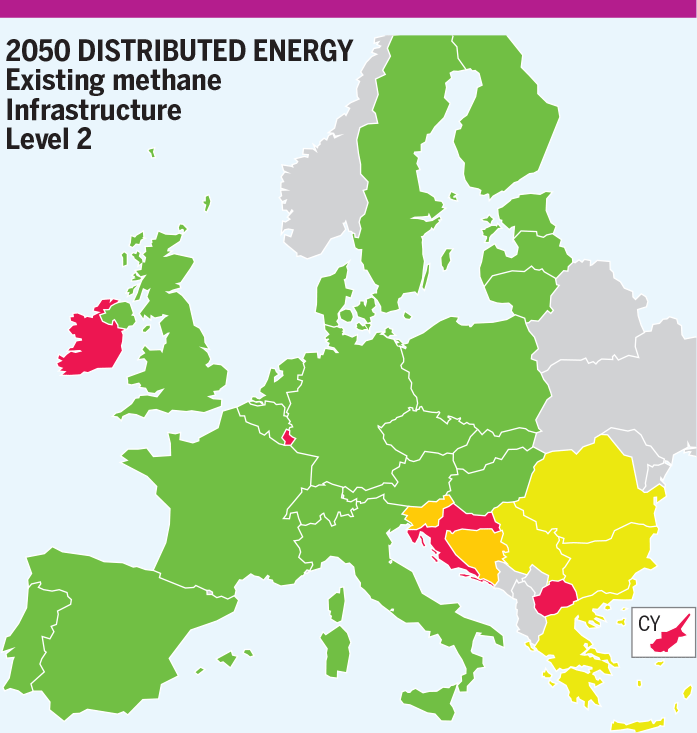
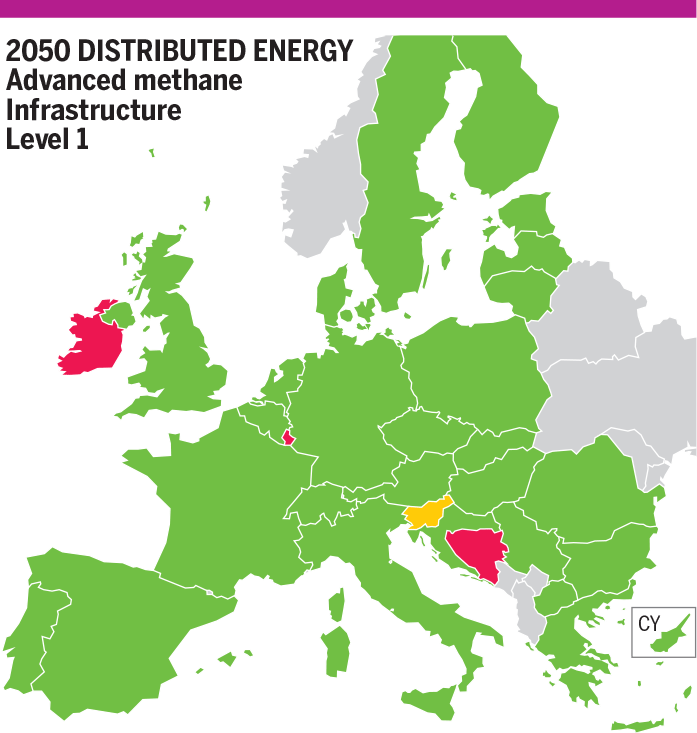
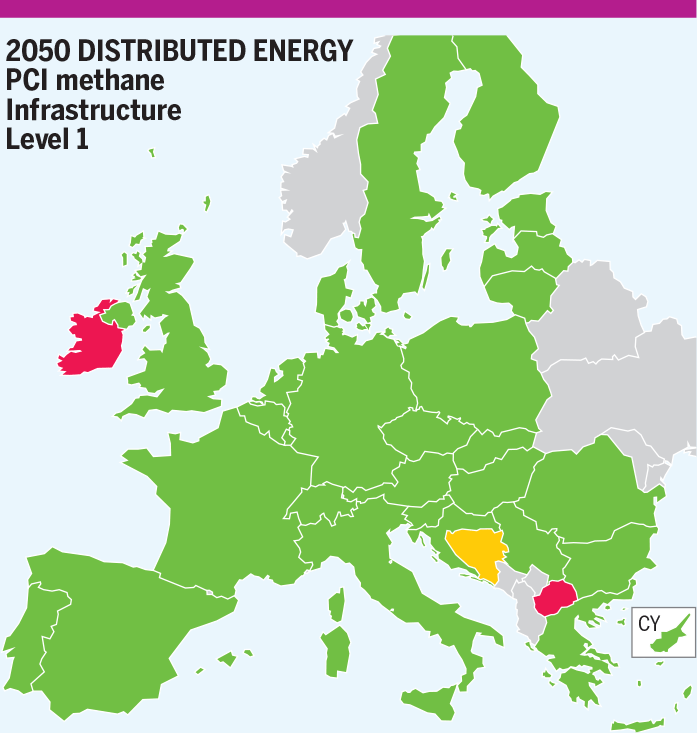
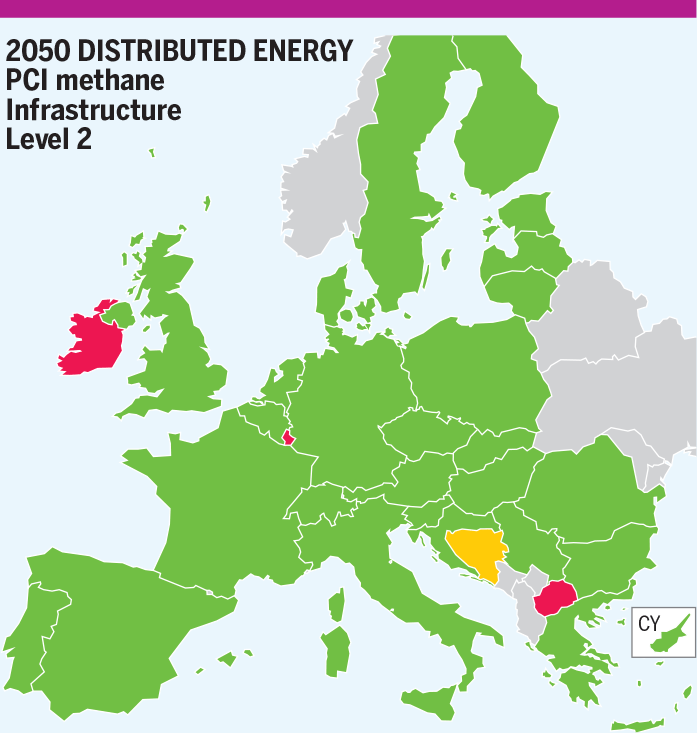
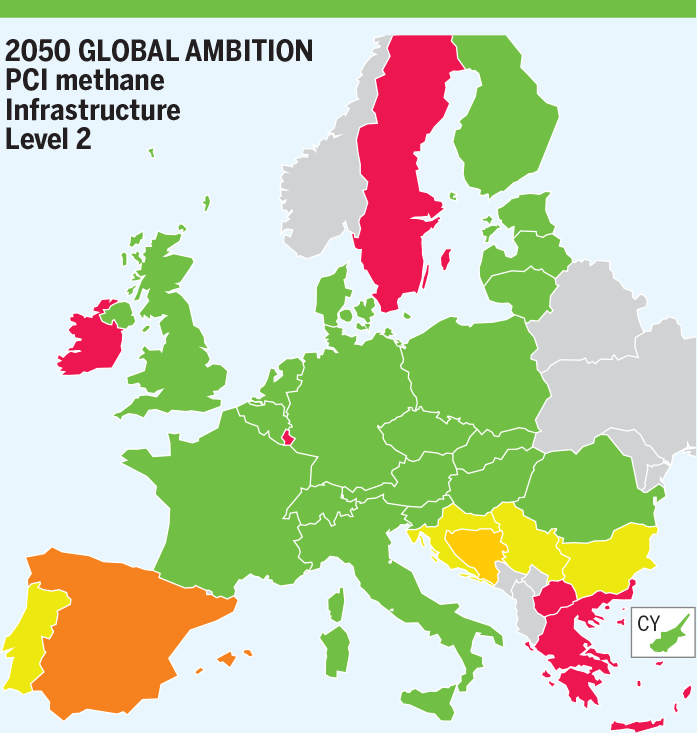
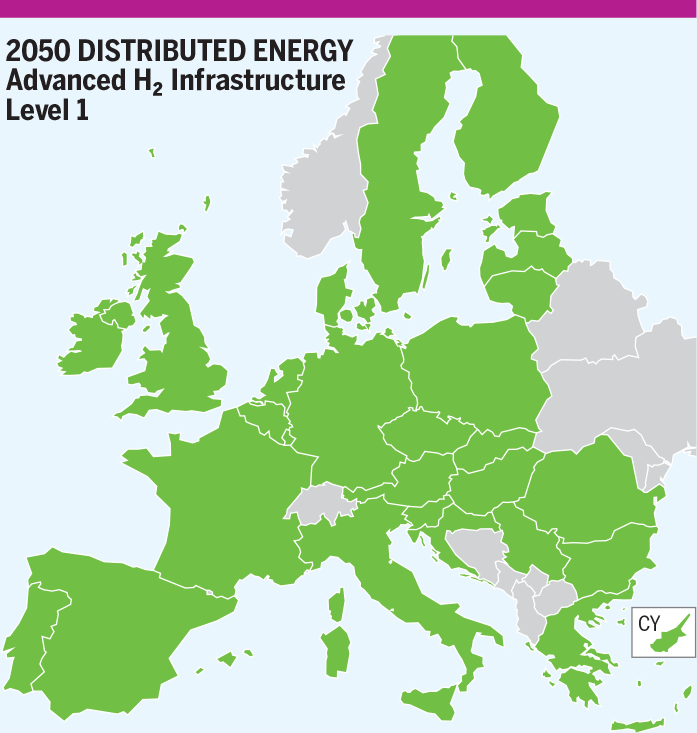
In Distributed Energy scenario, most of the countries show no demand curtailment. Some countries show demand curtailment due to infrastructure limitations and to hydrogen production using methane.
- Slovenia is exposed to 15 % demand curtailment, SLID corresponds to the interconnection with Austria and the only interconnection left with Italy cannot satisfy the demand.
- Bosnia and Herzegovina is exposed to 16 % demand curtailment, SLID is the interconnection with Serbia and, without any other interconnection, Bosnia and Herzegovina cannot mitigate its demand curtailment.
- Croatia shows 40 % demand curtailment, SLID is the Croatia LNG terminal and the interconnections with Slovenia and Hungary show infrastructure limitations (bottlenecks).
- Northern Ireland is exposed to 100 % demand curtailment due to SLID Ireland (Moffat), without any other interconnections.
- Ireland is exposed to 78 % demand curtailment due to SLID (Moffat).
- North Macedonia is exposed to 100 % demand curtailment, SLID is the interconnection with Greece and there are no other options to meet its demand.
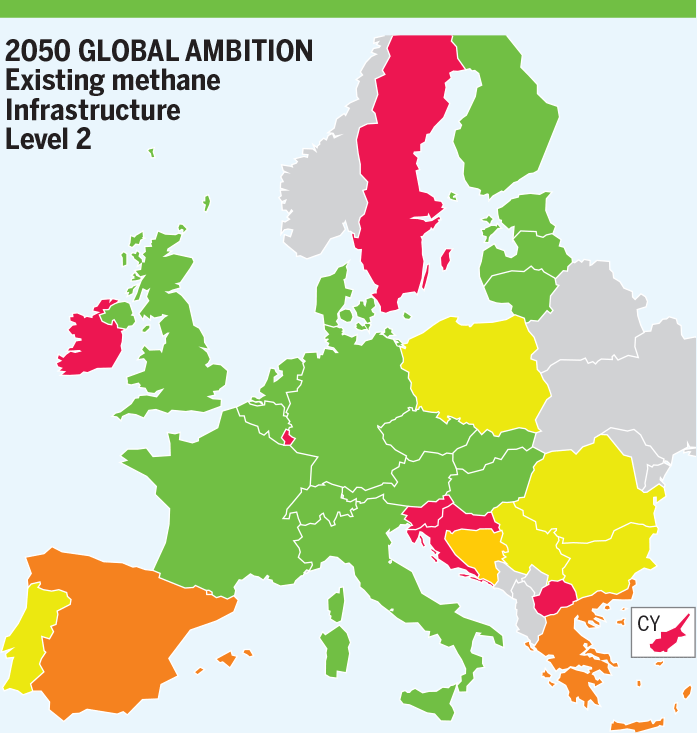
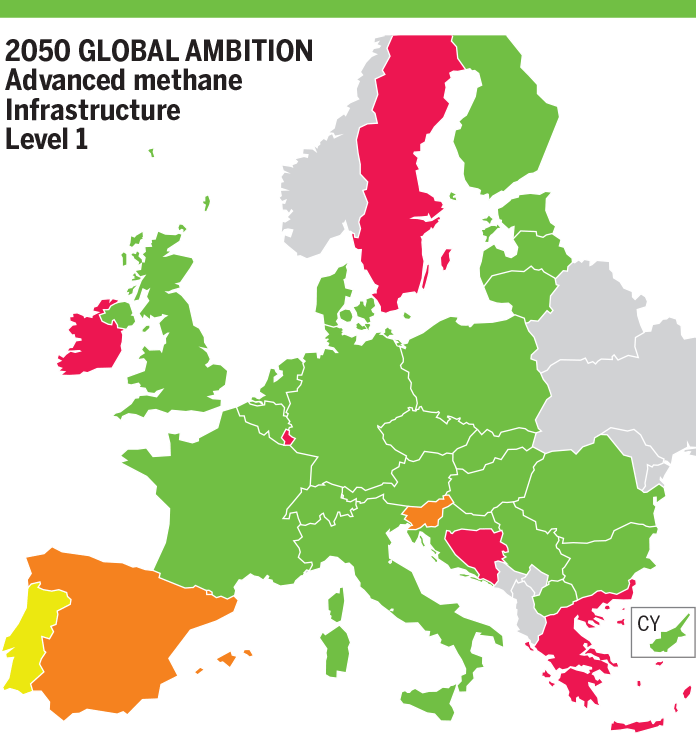
In H₂ Infrastructure level 1 Global Ambition scenario, most of the countries show no demand curtailment. Some countries show demand curtailment due to infrastructure limitations and to hydrogen production using methane.
- Bosnia and Herzegovina is exposed to 16 % demand curtailment, SLID is the interconnection with Serbia and, without any other interconnection, Bosnia and Herzegovina cannot mitigate its demand curtailment.
- Croatia shows 64 % demand curtailment, SLID is the Croatia LNG terminal and the interconnections with Slovenia and Hungary show infrastructure limitations.
- Northern Ireland is exposed to 100 % demand curtailment due to SLID Ireland (Moffat), without any other interconnections.
- Ireland is exposed to 79 % demand curtailment due to SLID (Moffat).
- North Macedonia is exposed to 100 % demand curtailment, SLID is the interconnection with Greece and there are no other options to meet its demand.
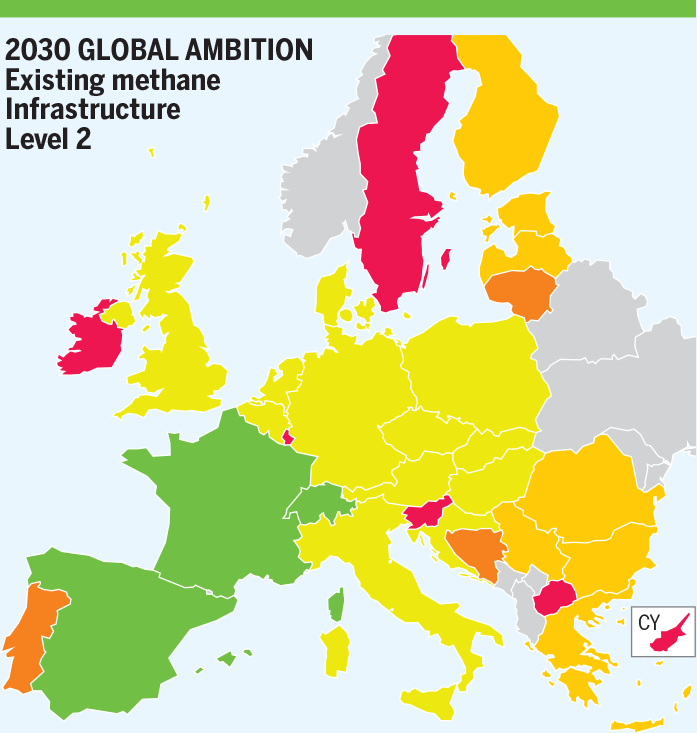
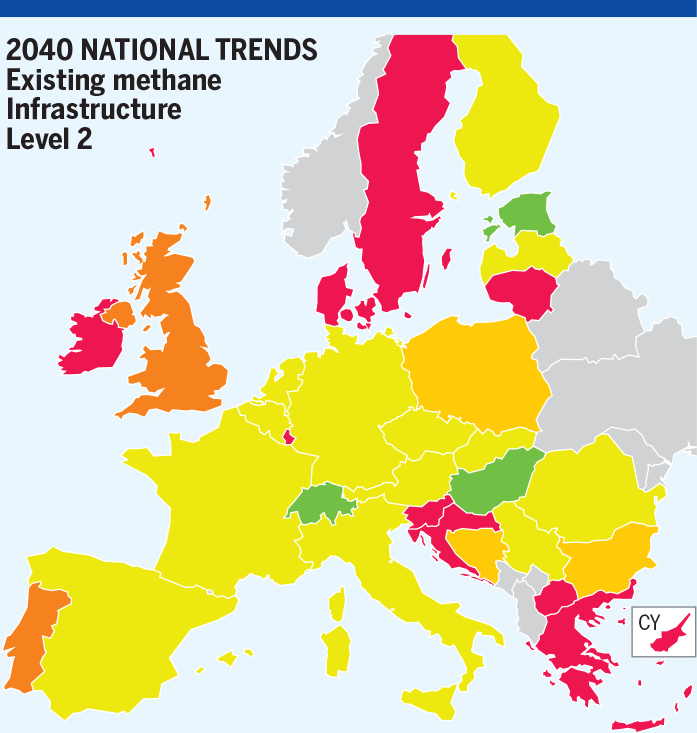
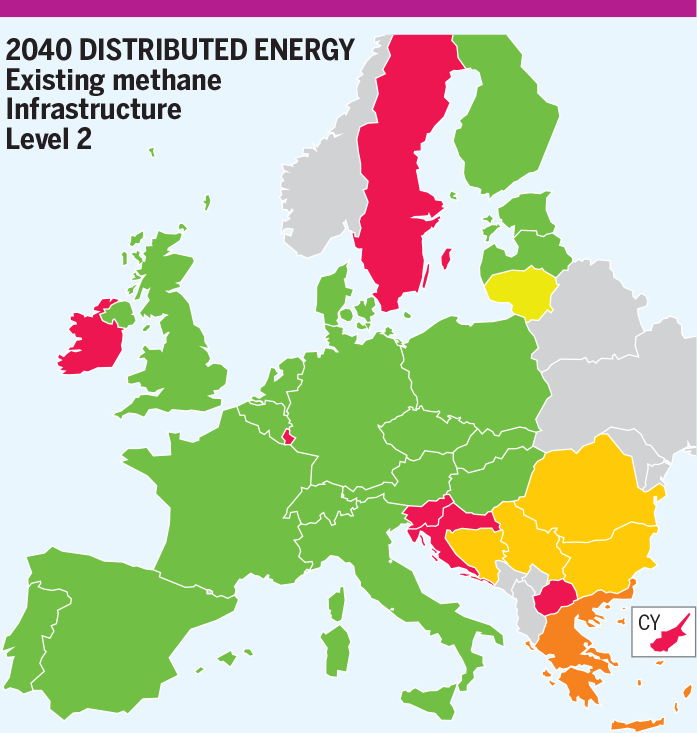
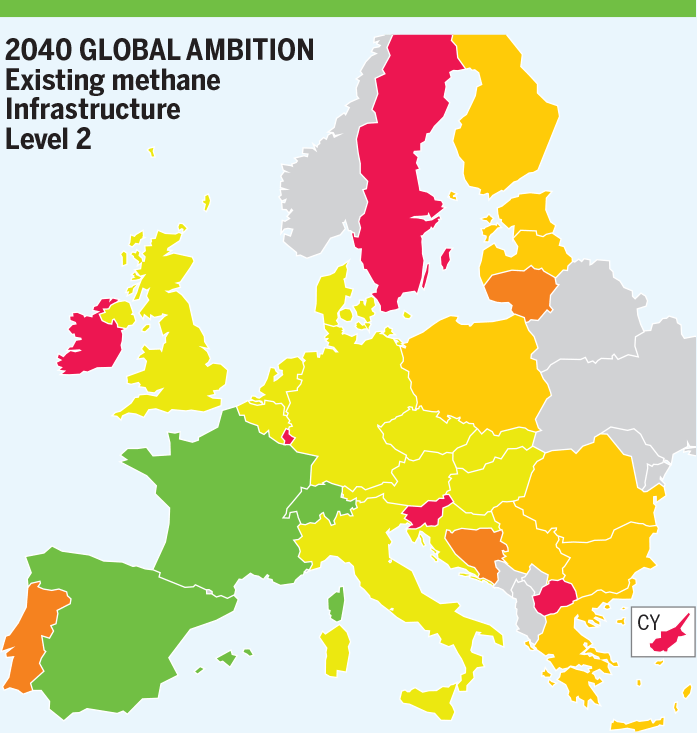
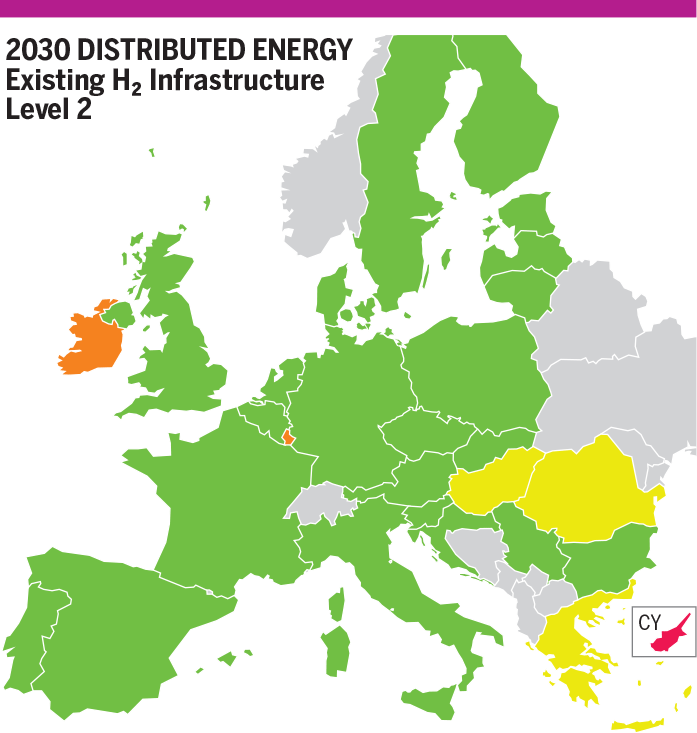
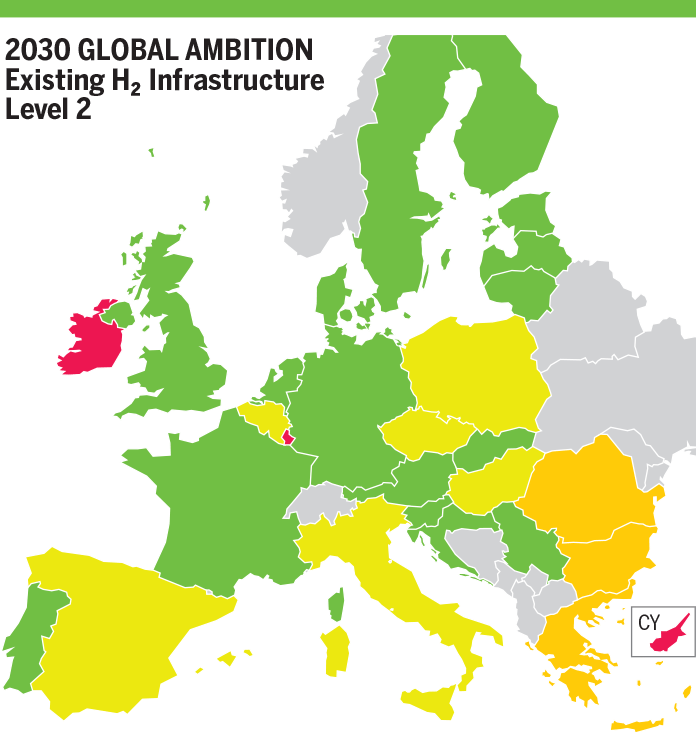
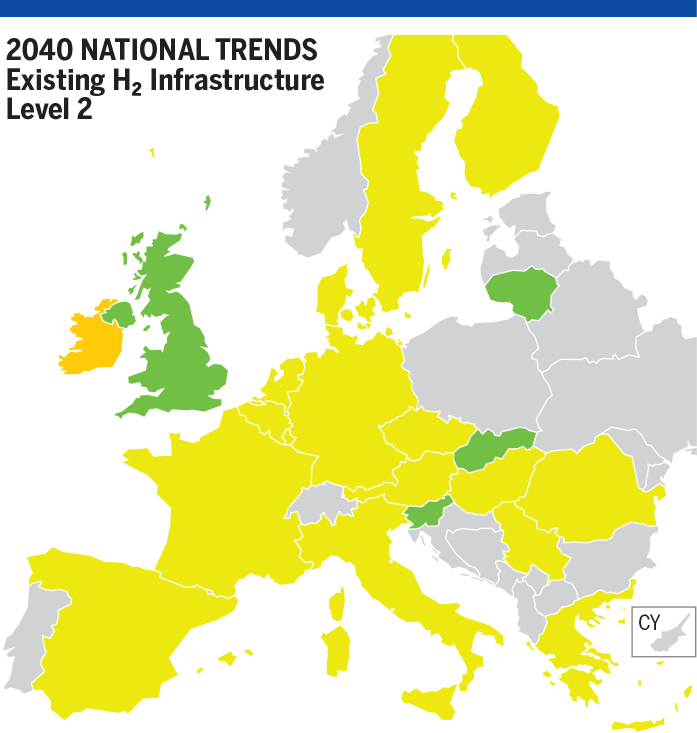
SLID Methane Results in CH₄ Existing Infrastructure – H₂ Infrastructure Level 2
- 2025 – Best estimate
In Best estimate scenario, demand curtailment is the same to the one in Level 1 in all countries.
- 2030
In National Trends scenario, most of the countries increase their demand curtailment (1 % to 2 %) due to more hydrogen production using methane.
In Distributed energy scenario, most of the countries already curtailed in infrastructure level 1 increase their demand curtailment by 1 % to 2 % due to higher hydrogen production using methane.
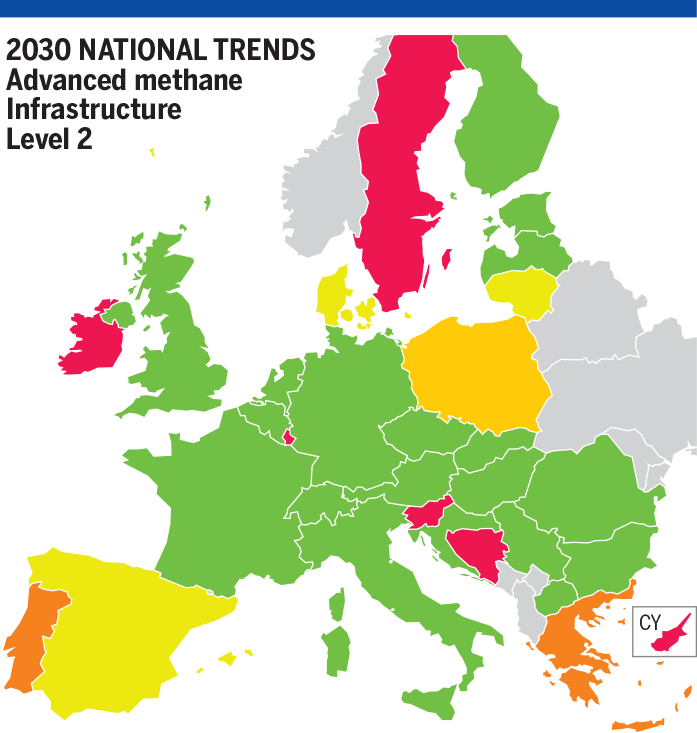
In Global Ambition scenario, some countries already curtailed in infrastructure level 1 increase their demand curtailment due to higher hydrogen production using methane. If some countries increase their demand curtailment of 1 %, Slovenia and Sweden increase their demand curtailment by 19 % and 7 %.
- 2040
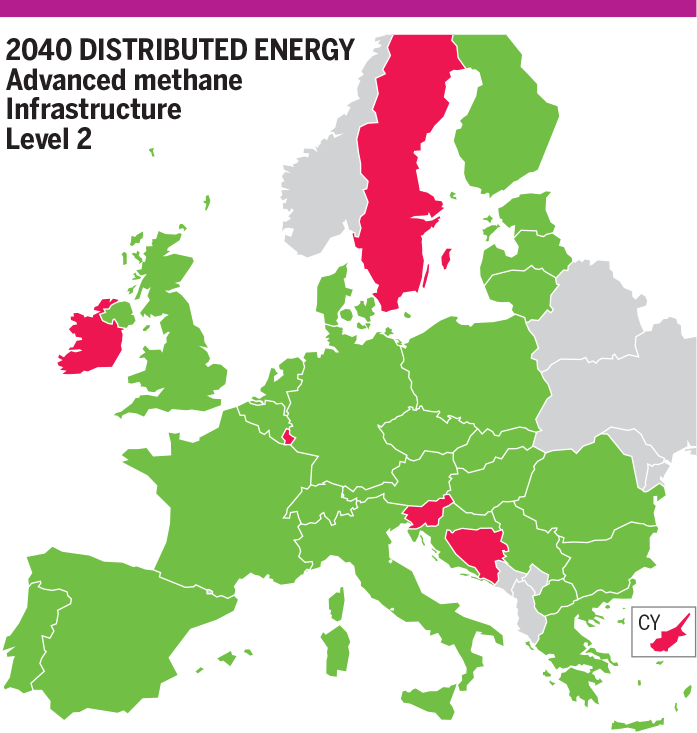
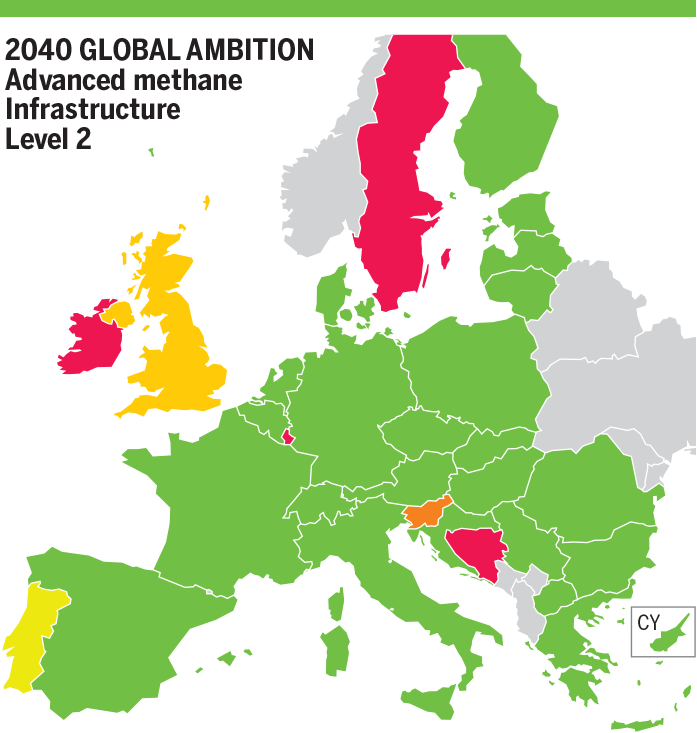
In National Trends scenario, due to higher hydrogen production using methane, all countries already curtailed in H₂ Infrastructure level 1 increase their demand curtailment and countries not curtailed show 2 % to 4 % demand curtailment.
In Distributed Energy scenario, demand curtailment values remain unchanged for most of the countries. Demand curtailment is mitigated in Bulgaria, Romania, Serbia and Sweden due to additional flexibility on the hydrogen infrastructure and less hydrogen production using methane. Demand curtailment increases in Greece and Luxembourg due to infrastructure limitations and the need of more hydrogen production.
In Global Ambition scenario, demand curtailment values remain unchanged for most of the countries. Demand curtailment is mitigated in Bulgaria, Romania, Greece, Croatia, North Macedonia, Serbia and Sweden due to additional flexibility on the hydrogen infrastructure and less hydrogen production using methane. Demand curtailment increases in Denmark, Poland, United Kingdom and Luxembourg due to infrastructure limitations and the need of more hydrogen production.
- 2050
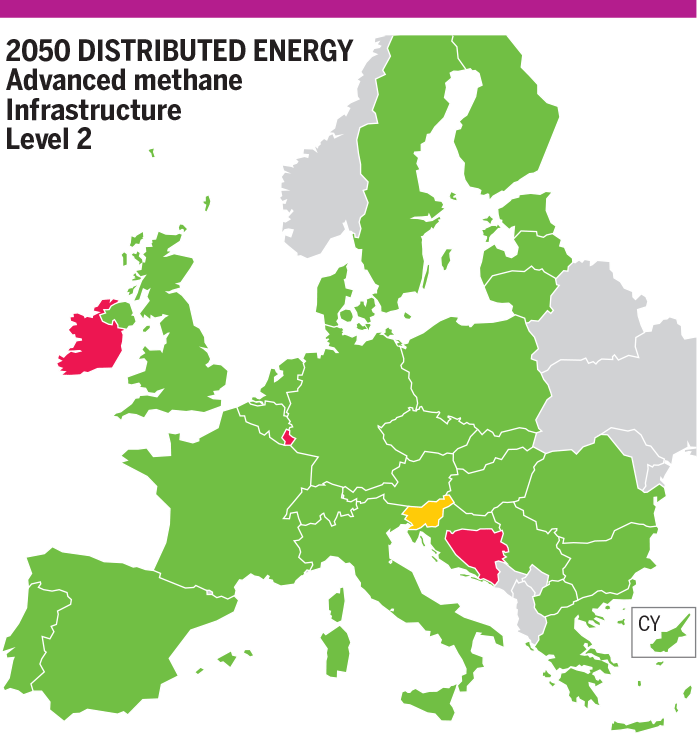
In Distributed Energy scenario, some countries not curtailed in H₂ Infrastructure level 1 show now curtailment due to higher hydrogen production using methane: Bulgaria, Greece, Luxembourg, Romania and Serbia.
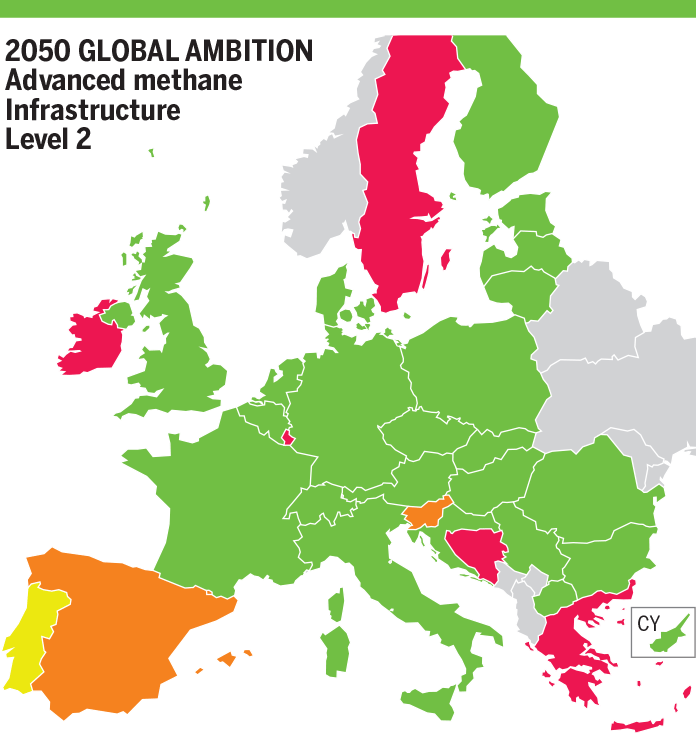
In Global Ambition scenario, some countries not curtailed in H₂ Infrastructure level 1 show now curtailment due to higher hydrogen production using methane: Bulgaria, Greece, Spain, Luxembourg, Romania and Serbia.
Due to additional interconnection in H₂ Infrastructure level 2 and less hydrogen production using methane, Croatia, North Macedonia and Sweden mitigate their demand curtailment.
13.2 Advanced Infrastructure (Methane Results)
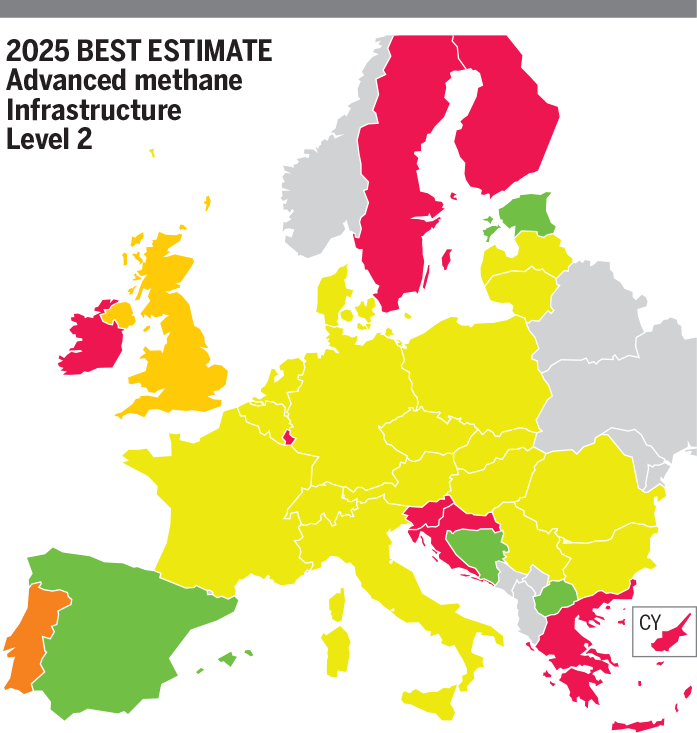
- 2025 – Best Estimate
H₂ Infrastructure Level 1
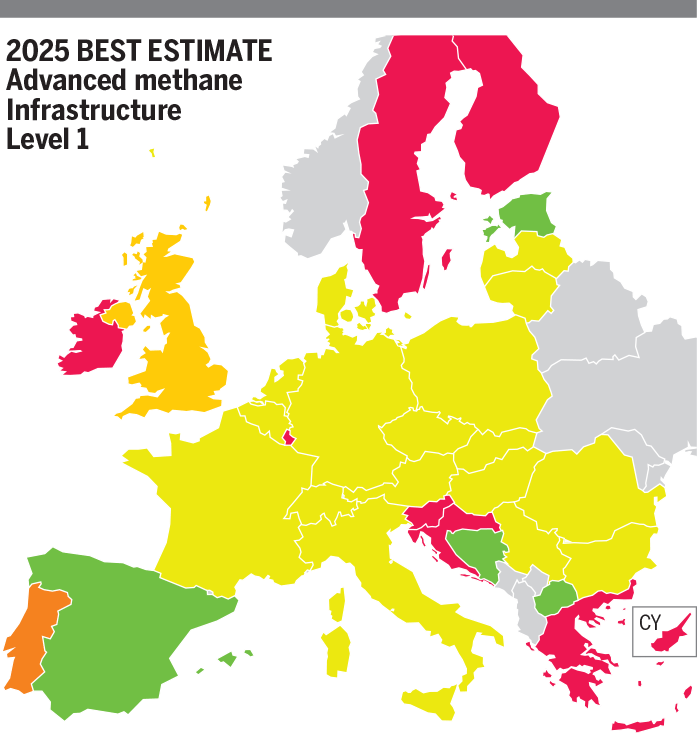
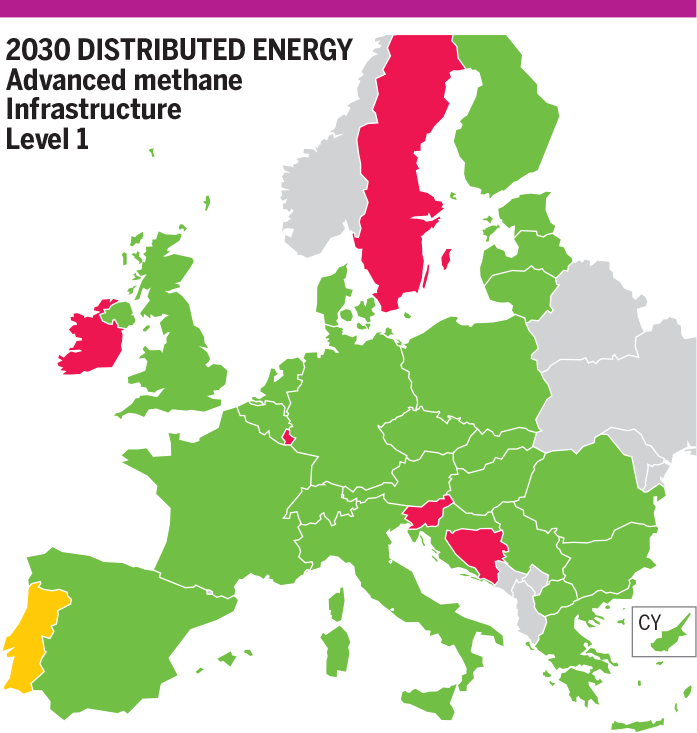
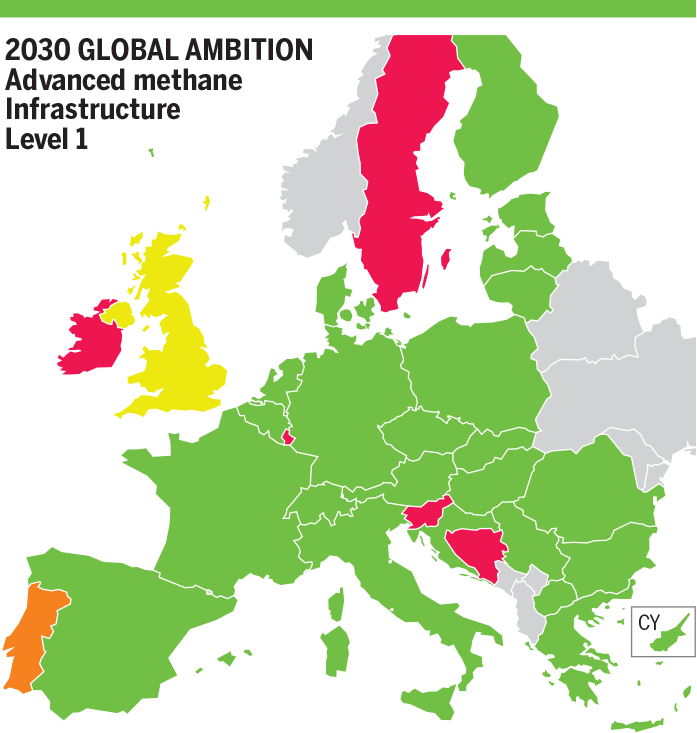
In Best Estimate scenario, situation remains unchanged for some countries (Germany, Estonia, France, Italy, Portugal, Czech Republic, Poland, Serbia and Northern Ireland). In Advanced Infrastructure level, additional infrastructure and capacities mitigate demand curtailment in some countries (Denmark, Greece, Hungary, Lithuania, Latvia, North Macedonia and The Netherlands) and some countries increased their demand curtailment due to repurposed infrastructure (Austria, Belgium, Bulgaria, Switzerland, Finland, Croatia, Ireland, Luxembourg, Romania, Sweden, Slovenia, Slovakia and United Kingdom).
H₂ Infrastructure Level 2
In Best Estimate scenario, situation remains unchanged for most of the countries, only Bulgaria fully mitigates its demand curtailment and Germany, Hungary and The Netherlands decrease by 1 % their demand curtailment due to more hydrogen production using methane.
- 2030
H₂ Infrastructure Level 1
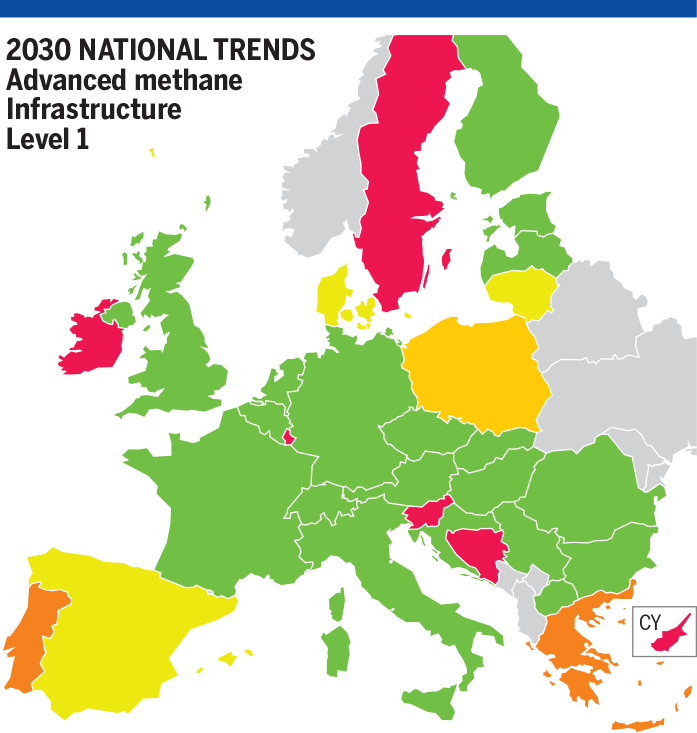
In National Trends scenario, all countries mitigate their demand curtailment except for Bosnia and Herzegovina (+ 6 %), Luxembourg (+ 6 %), Sweden (+ 6 %) and Slovenia (+ 5 %). These countries have no benefits in advanced and cooperate more with other countries.
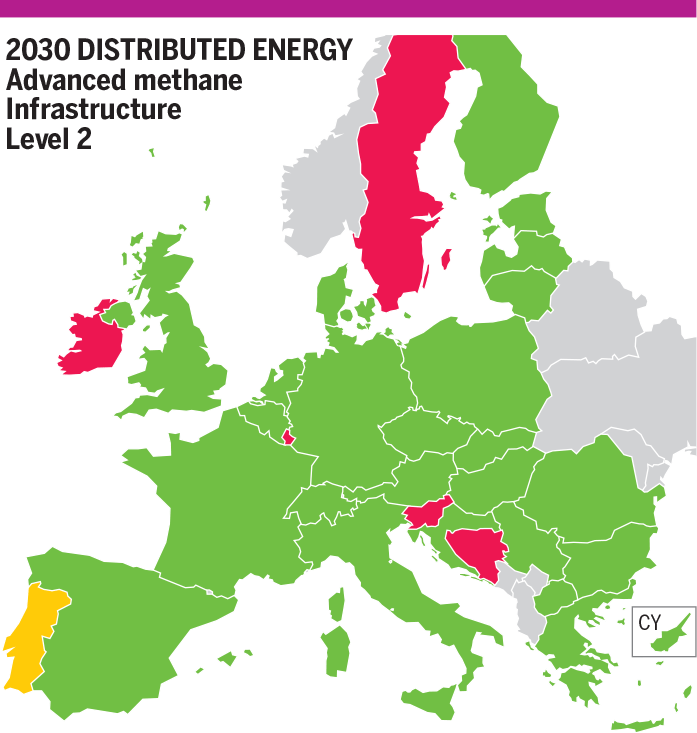
In Distributed Energy scenario, situation worsens in Bosnia and Herzegovina with more impact for the SLID Bosnia. Most of the countries are not impacted by the Advanced Infrastructure level and some countries fully mitigate their demand curtailment due to additional flexibility (Bulgaria, Estonia, Finland, Greece, Lithuania, Latvia, North Macedonia, Romania and Serbia).
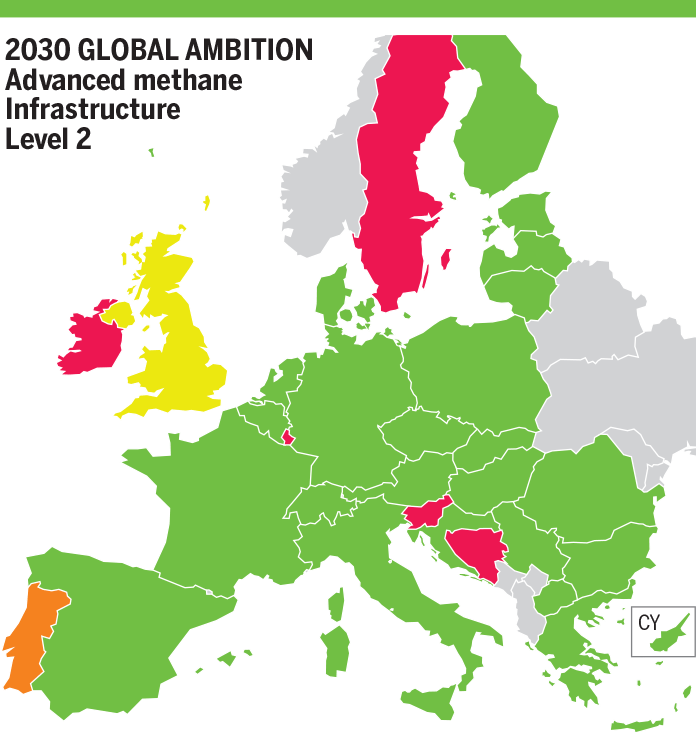
In Global Ambition scenario, situation worsens in Bosnia and Herzegovina with more impact for the SLID Bosnia. Most of the countries are not impacted by the Advanced Infrastructure level and many countries fully mitigate their demand curtailment due to additional flexibility (Bulgaria, Czech Republic, Germany, Denmark, Estonia, Finland, Greece, Croatia, Hungary, Lithuania, Italy, Latvia, The Netherlands, North Macedonia, Poland, Romania, Slovakia, United Kingdom and Serbia) due to the projects in advanced and additional flexibility.
H₂ Infrastructure Level 2
In National Trends scenario, situation remains unchanged compared to H₂ Infrastructure level 1.
In Distributed Energy scenario, situation remains unchanged compared to H₂ Infrastructure level 1.
In Global Ambition scenario, situation remains unchanged compared to H₂ Infrastructure level 1.
- 2040
H₂ Infrastructure Level 1
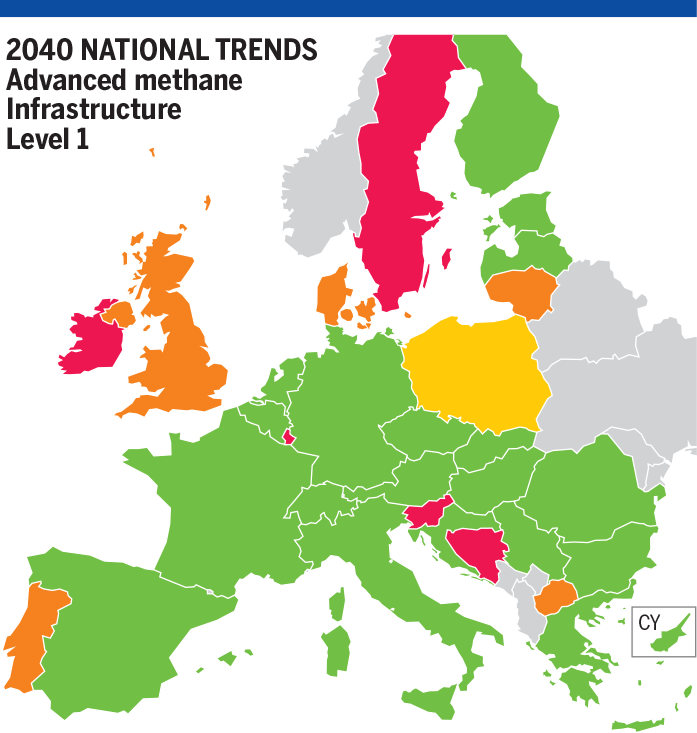
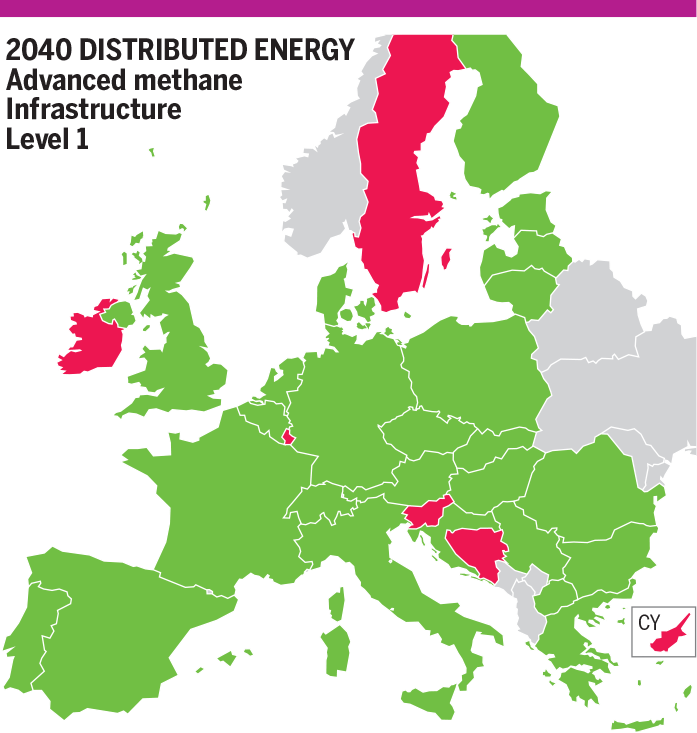
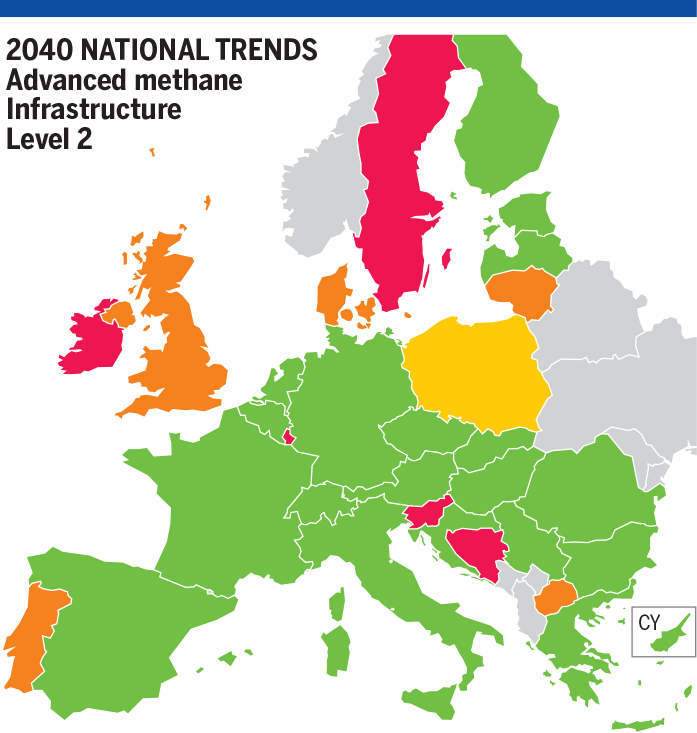
In National Trends scenario, for most of the countries, the situation remains unchanged. Some countries improved the situation due to the additional flexibility in Advanced Infrastructure level: Bulgaria, Greece, Croatia and Serbia fully mitigate demand curtailment. Some countries partially mitigate their demand curtailment: Denmark, Lithuania and North Macedonia.
In Distributed Energy scenario, the situation remains unchanged for most of the countries. Situation worsens in Bosnia and Herzegovina with more impact for the SLID Bosnia. Bulgaria, Greece, Croatia, Lithuania, North Macedonia, Romania and Serbia fully mitigate their demand curtailment due to the additional flexibility in advanced.
In Global Ambition scenario, the situation remains unchanged for most of the countries. Situation worsens in Bosnia and Herzegovina with more impact for the SLID Bosnia. Bulgaria, Denmark, Greece, Croatia, Lithuania, North Macedonia, Poland, Romania and Serbia fully mitigate their demand curtailment due to the additional flexibility in advanced.
H₂ Infrastructure Level 2
In National Trends scenario, situation remains unchanged compared to H₂ Infrastructure level 1.
In Distributed Energy scenario, situation remains unchanged compared to H₂ Infrastructure level 1.
In Global Ambition, situation remains unchanged compared to H₂ Infrastructure level 1 except for in Portugal now exposed to 2 % demand curtailment due to infrastructure limitation with Spain and additional hydrogen production using methane.
- 2050
H₂ Infrastructure Level 1
In Distributed Energy scenario, the situation remains unchanged for most of the countries. Situation worsens in Bosnia and Herzegovina with more impact for the SLID Bosnia. Croatia, and North Macedonia fully mitigate demand curtailment due to the additional flexibility in advanced.
In Global Ambition scenario, the situation remains unchanged for most of the countries. Situation worsens in Bosnia and Herzegovina with more impact for the SLID Bosnia. Croatia, and North Macedonia fully mitigate demand curtailment due to the additional flexibility in advanced.
H₂ Infrastructure Level 2
In Global Ambition scenario, situation remains unchanged compared to H₂ Infrastructure level 1.
In Distributed Energy scenario, situation also remains unchanged.
SLID Methane Results in CH₄ Advanced Infrastructure – H₂ Infrastructure Level 1

Figure 13.3: Methane SLID Results for Peak Demand in Advanced CH₄ Infrastructure with H₂ Level 1
SLID Methane Results in CH₄ Advanced Infrastructure – H₂ Infrastructure Level 2

Figure 13.4: Methane SLID Results for Peak Demand in Advanced CH₄ Infrastructure with H₂ Level 2
13.3 PCI Infrastructure (Methane Results)
- 2025 – Best Estimate
H₂ Infrastructure Level 1
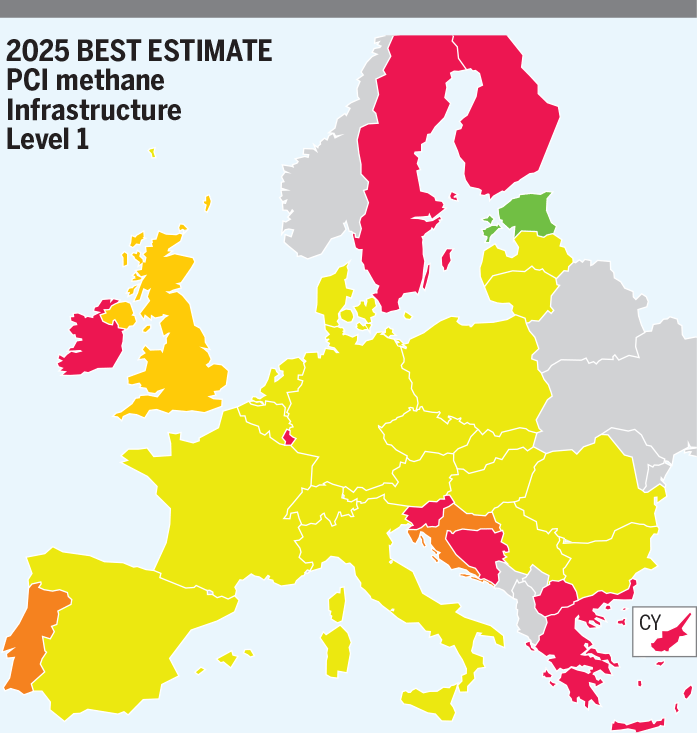
In Best Estimate scenario, situation remains unchanged for some countries (Germany, Estonia, France, Italy, Portugal, Czech Republic, Poland, Serbia and Northern Ireland). In Advanced Infrastructure level, additional infrastructure and capacities mitigate demand curtailment in some countries (Denmark, Greece, Hungary, Lithuania, Latvia, North Macedonia and The Netherlands) and some countries increased their demand curtailment due to repurposed infrastructure (Austria, Belgium, Bulgaria, Switzerland, Finland, Croatia, Ireland, Luxembourg, Romania, Sweden, Slovenia, Slovakia and United Kingdom).
H₂ Infrastructure Level 2
In Best Estimate scenario, situation remains unchanged for most of the countries, only Bulgaria fully mitigates its demand curtailment and Germany, Hungary and The Netherlands decrease by 1 % their demand curtailment due to more hydrogen production using methane.
- 2030
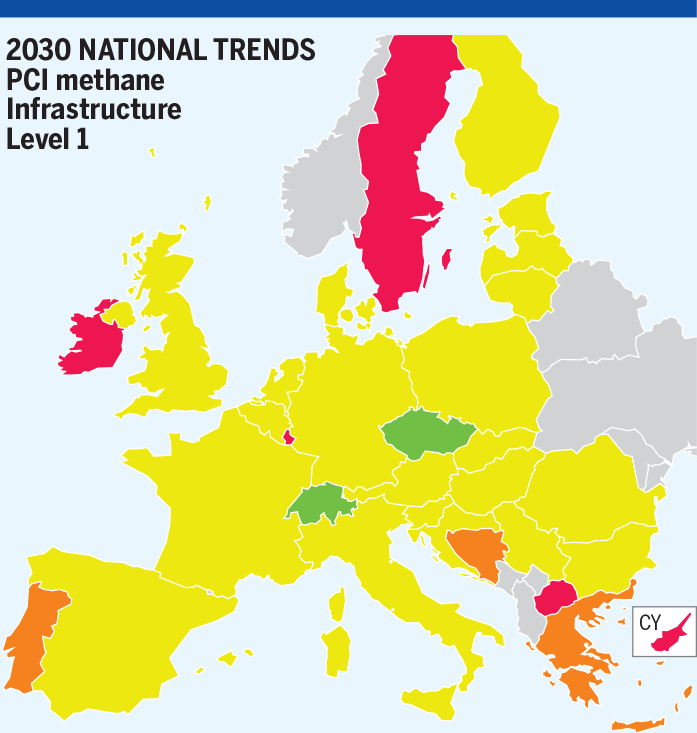
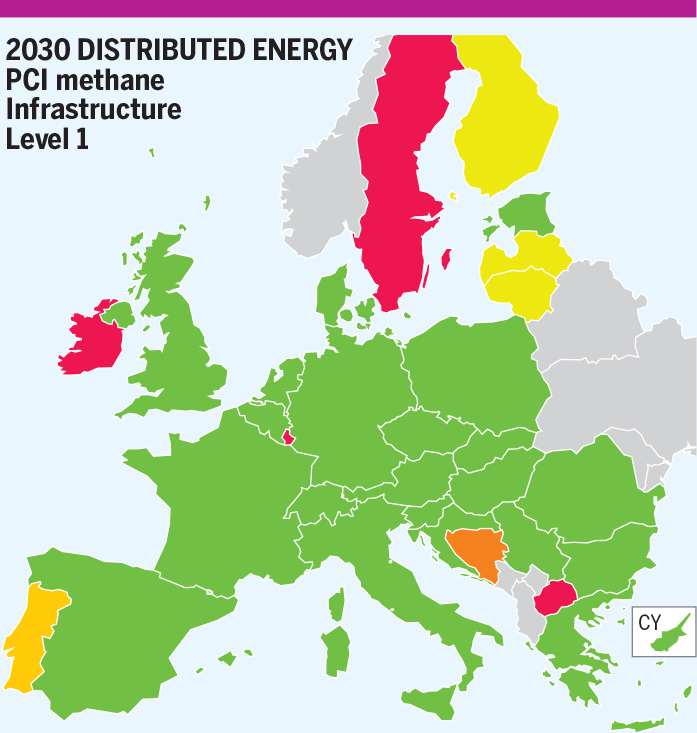
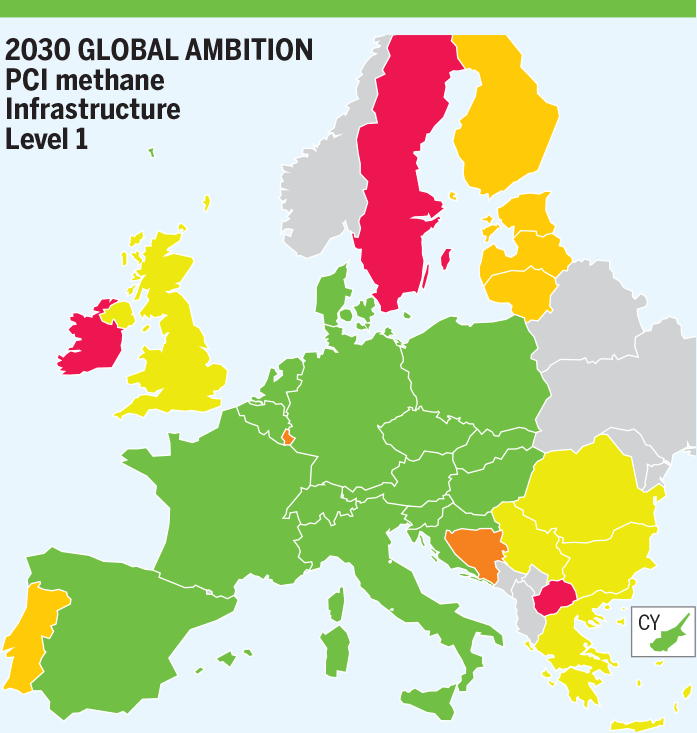
H₂ Infrastructure Level 1
In National Trends scenario, all countries mitigate their demand curtailment except for Bosnia and Herzegovina (+ 6 %), Luxembourg (+ 6 %), Sweden (+ 6 %) and Slovenia (+ 5 %). These countries have no benefits in advanced and cooperate more with other countries.
In Distributed Energy scenario, situation worsens in Bosnia and Herzegovina with more impact for the SLID Bosnia. Most of the countries are not impacted by the Advanced Infrastructure level and some countries fully mitigate their demand curtailment due to additional flexibility (Bulgaria, Estonia, Finland, Greece, Lithuania, Latvia, North Macedonia, Romania and Serbia).
In Global Ambition scenario, situation worsens in Bosnia and Herzegovina with more impact for the SLID Bosnia. Most of the countries are not impacted by the Advanced Infrastructure level and many countries fully mitigate their demand curtailment due to additional flexibility (Bulgaria, Czech Republic, Germany, Denmark, Estonia, Finland, Greece, Croatia, Hungary, Lithuania, Italy, Latvia, The Netherlands, North Macedonia, Poland, Romania, Slovakia, United Kingdom and Serbia) due to the projects in advanced and additional flexibility.
H₂ Infrastructure Level 2
In National Trends scenario, situation remains unchanged compared to H₂ Infrastructure level 1.
In Distributed Energy scenario, situation remains unchanged compared to H₂ Infrastructure level 1.
In Global Ambition scenario, situation remains unchanged compared to H₂ Infrastructure level 1.
- 2040
H₂ Infrastructure Level 1
In National Trends scenario, for most of the countries, the situation remains unchanged. Some countries improved the situation due to the additional flexibility in Advanced Infrastructure level: Bulgaria, Greece, Croatia and Serbia fully mitigate demand curtailment. Some countries partially mitigate their demand curtailment: Denmark, Lithuania and North Macedonia.
In Distributed Energy scenario, the situation remains unchanged for most of the countries. Situation worsens in Bosnia and Herzegovina with more impact for the SLID Bosnia. Bulgaria, Greece, Croatia, Lithuania, North Macedonia, Romania and Serbia fully mitigate their demand curtailment due to the additional flexibility in advanced.
In Global Ambition scenario, the situation remains unchanged for most of the countries. Situation worsens in Bosnia and Herzegovina with more impact for the SLID Bosnia. Bulgaria, Denmark, Greece, Croatia, Lithuania, North Macedonia, Poland, Romania and Serbia fully mitigate their demand curtailment due to the additional flexibility in advanced.
H₂ Infrastructure Level 2
In National Trends scenario, situation remains unchanged compared to H₂ Infrastructure level 1.
In Distributed Energy scenario, situation remains unchanged compared to H₂ Infrastructure level 1.
In Global Ambition, situation remains unchanged compared to H₂ Infrastructure level 1 except for in Portugal now exposed to 2 % demand curtailment due to infrastructure limitation with Spain and additional hydrogen production using methane.
- 2050
H₂ Infrastructure Level 1
In Distributed Energy scenario, the situation remains unchanged for most of the countries. Situation worsens in Bosnia and Herzegovina with more impact for the SLID Bosnia. Croatia, and North Macedonia fully mitigate demand curtailment due to the additional flexibility in advanced.
In Global Ambition scenario, the situation remains unchanged for most of the countries. Situation worsens in Bosnia and Herzegovina with more impact for the SLID Bosnia. Croatia, and North Macedonia fully mitigate demand curtailment due to the additional flexibility in advanced.
H₂ Infrastructure Level 2
In Global Ambition scenario, situation remains unchanged compared to H₂ Infrastructure level 1.
In Distributed Energy scenario, situation also remains unchanged.
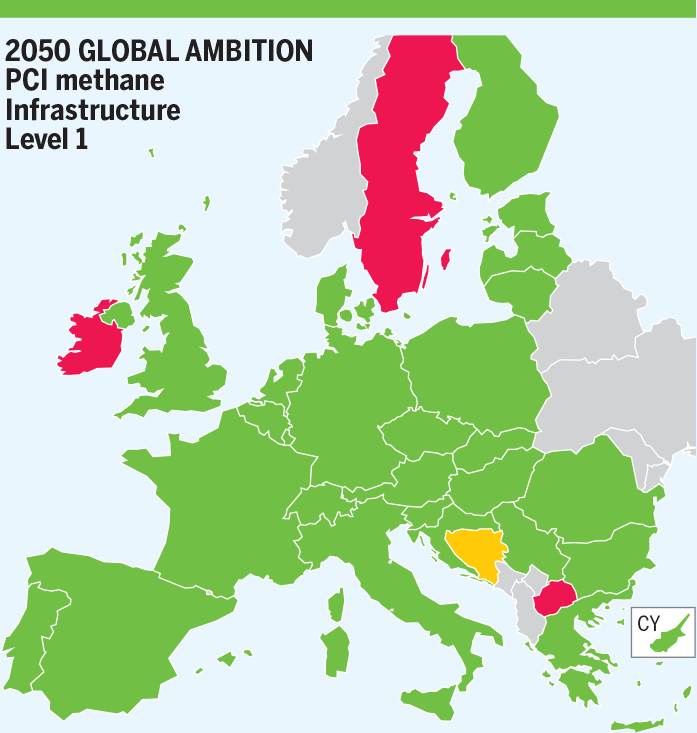
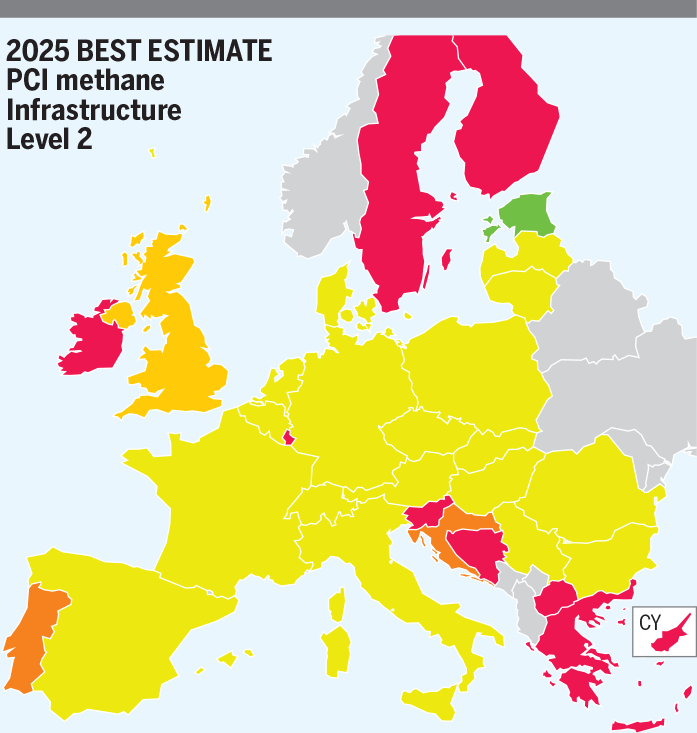
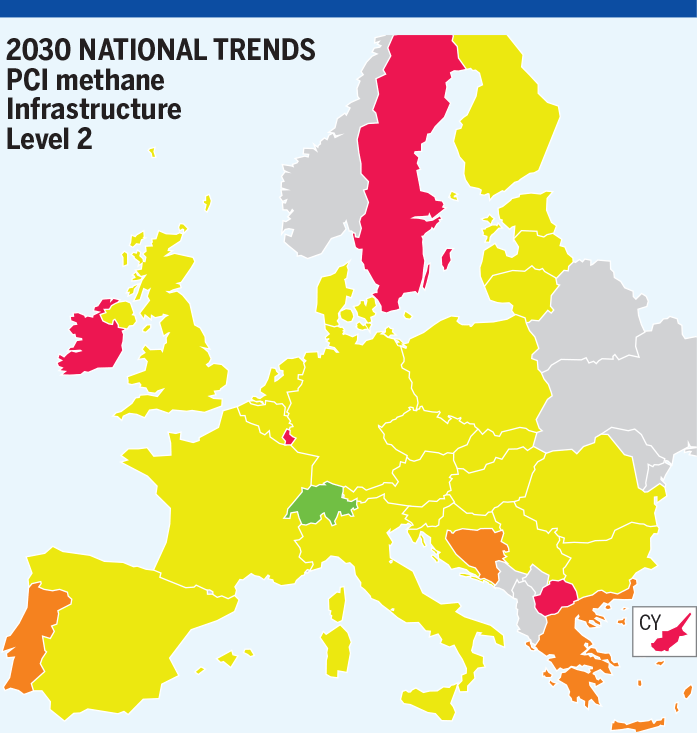
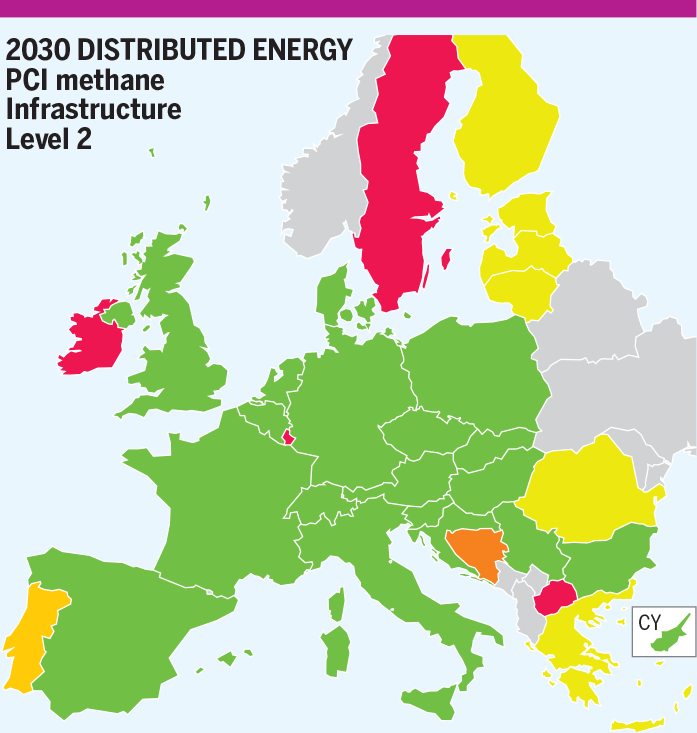
SLID Methane Results in CH₄ PCI Infrastructure – H₂ Infrastructure Level 1

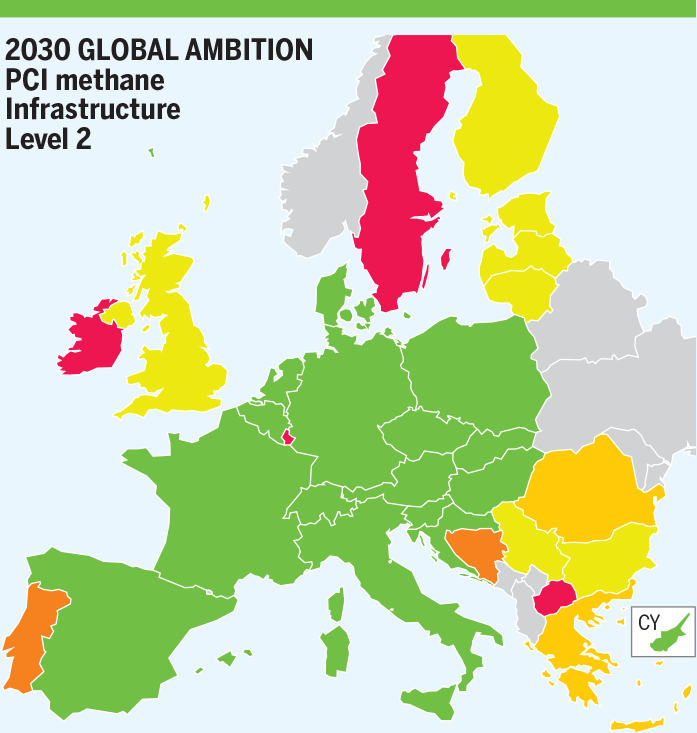
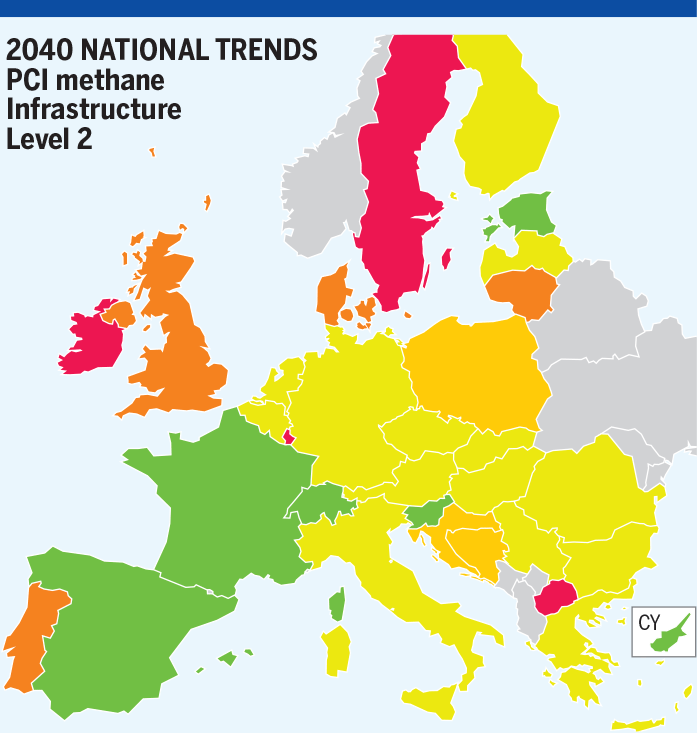
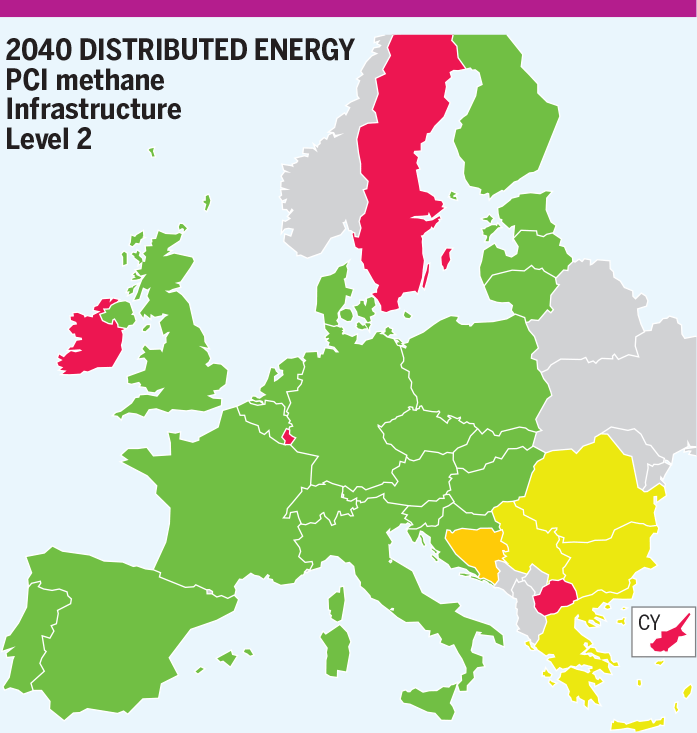
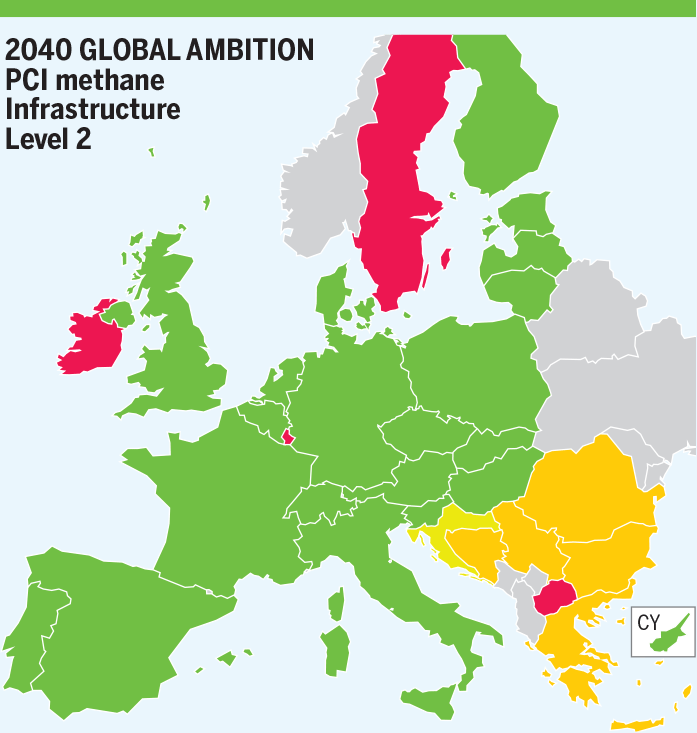
Figure 13.5: Methane SLID Results for Peak Demand in PCI CH₄ Infrastructure with H₂ Level 1
SLID Methane Results in CH₄ PCI Infrastructure – H₂ Infrastructure Level 2

Figure 13.6: Methane SLID Results for Peak Demand in PCI CH₄ Infrastructure with H₂ Level 2
13.4 Existing Infrastructure level (Hydrogen Results)
- 2025 – Best Estimate
H₂ Infrastructure Level 1
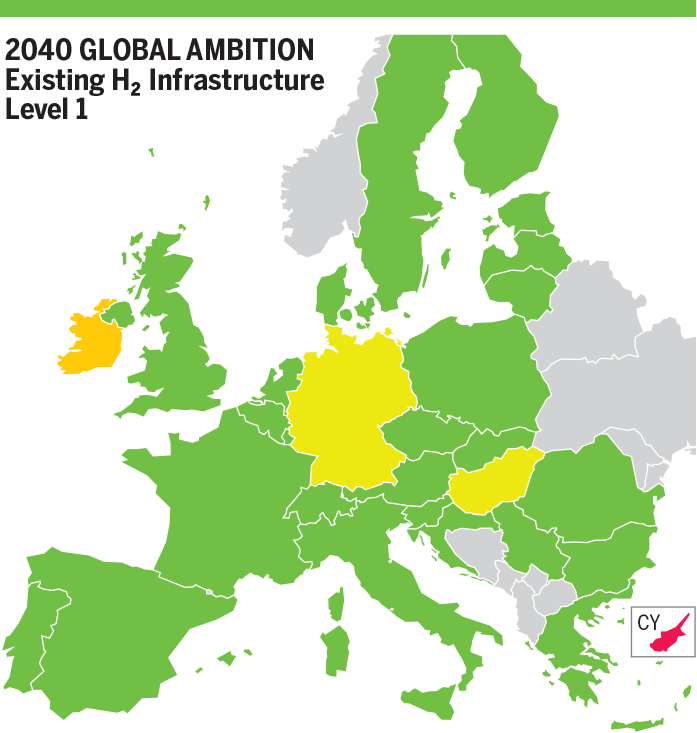
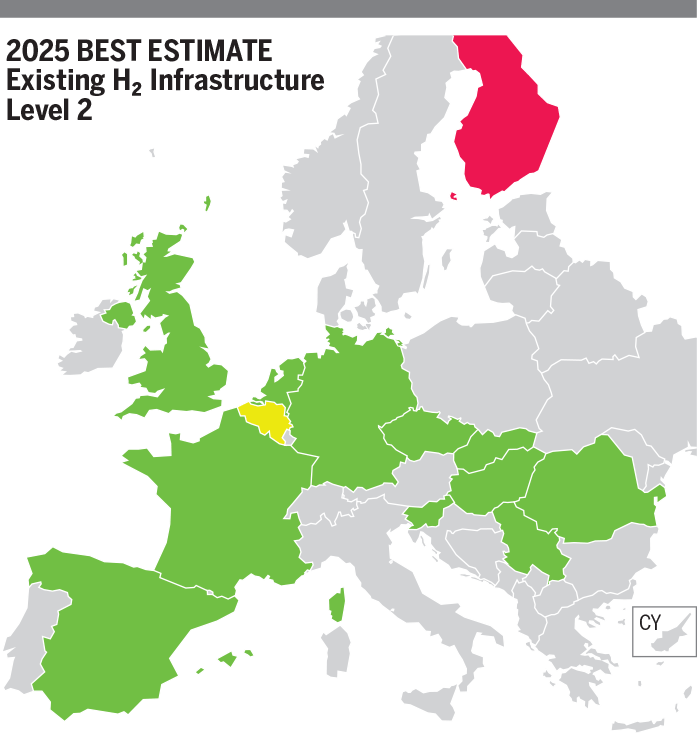
In Best Estimate scenario, all countries show no impact on demand curtailment as there is no hydrogen production using methane.
H₂ Infrastructure Level 2
In Best Estimate scenario, only Belgium and Finland show respectively 3 % and 33 % demand curtailment due to more hydrogen production using methane.
- 2030
H₂ Infrastructure Level 1
In National Trends all countries show no impact on demand curtailment as there in no hydrogen production using methane in this scenario.
In Distributed Energy scenario, all countries show no impact on demand curtailment except for Germany with 1 % more due to higher hydrogen production using methane.
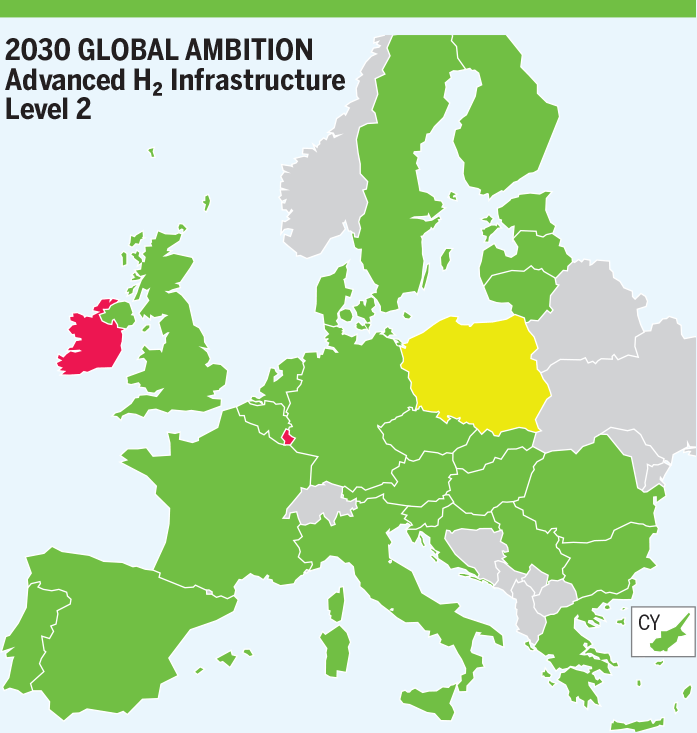
In Global Ambition scenario, most of the countries show no demand curtailment. Some countries show demand curtailment (Germany, Italy, Poland, Belgium) 1 %, (Greece, Hungary, Romania and Bulgaria) due to hydrogen production using methane.
H₂ Infrastructure Level 2
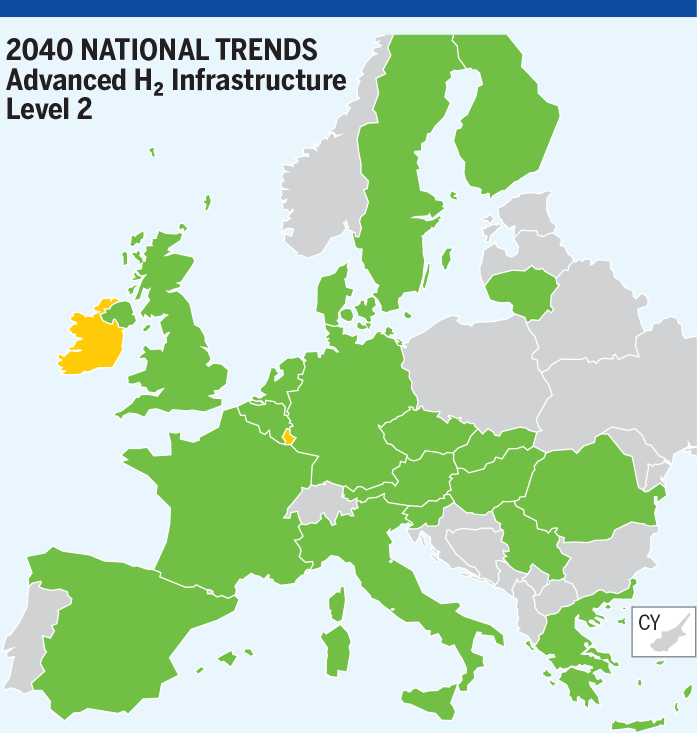
In National Trends scenario, most of the countries show same results. Some countries increase their demand curtailment due to higher hydrogen production using methane (Italy, Hungary, Germany, The Netherlands, Belgium, France) 2 %, United Kingdom 7 % and Luxembourg 17 %.
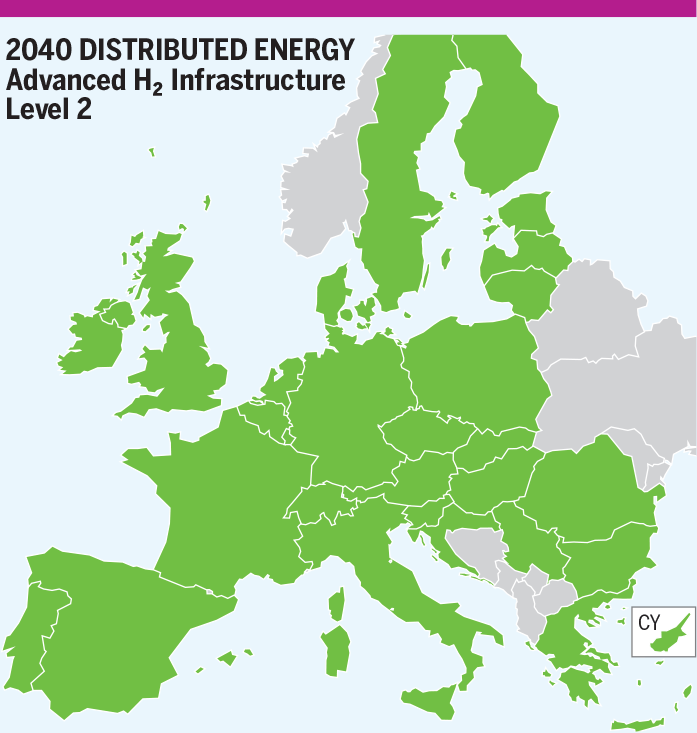
In Distributed Energy scenario, most of the countries show same results. Some countries increase their demand curtailment due to higher hydrogen production using methane (Germany, Sweden, The Netherlands, Hungary, Greece, Romania) 2 %, Luxembourg 16 % and Ireland 28 %.
In Global Ambition scenario, most of the countries show no demand curtailment. Some countries show demand curtailment (France, Austria, Germany, The Netherlands, Poland, Czech Republic, Belgium, Spain, Italy) 1 %, Hungary 9 %, (Romania, Greece, Bulgaria) 11 %, Luxembourg, 21 % and Ireland 34 % due to more hydrogen production using methane.
- 2040
H₂ Infrastructure Level 1
In National Trends scenario, all countries show no impact on demand curtailment due to no hydrogen production using methane.
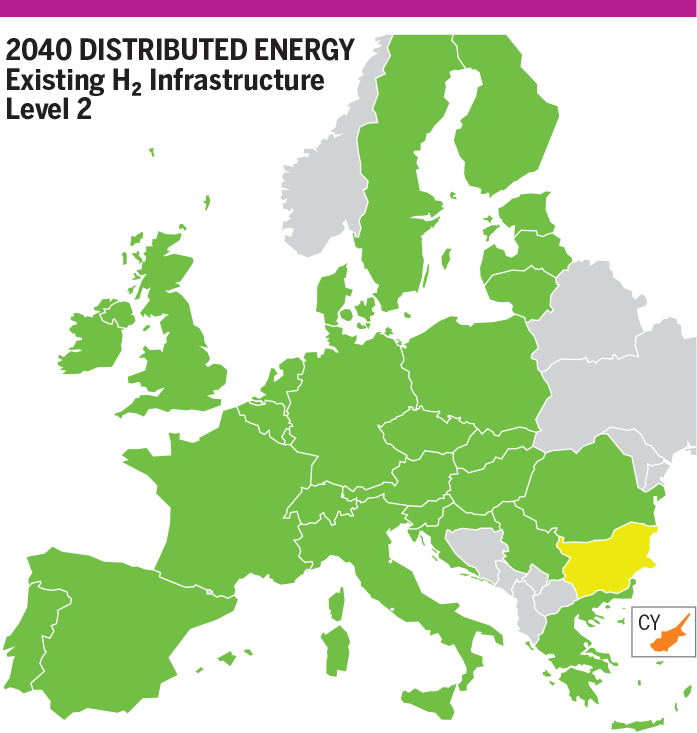
In Distributed Energy scenario, all countries show no impact on demand curtailment except for in Greece and France with 1 % due to hydrogen production using methane.
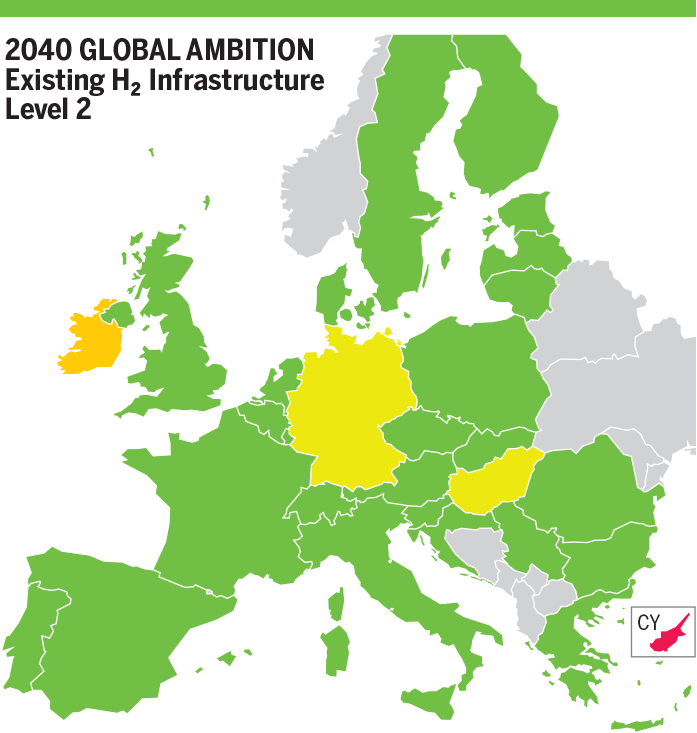
In Global Ambition scenario, all countries show no impact on demand curtailment.
H₂ Infrastructure Level 2
In National Trends scenario, most of the countries show demand curtailment except for United Kingdom, Lithuania, Slovenia and Slovakia. Some countries increase their demand curtailment due to hydrogen production using methane (Serbia, Denmark, Greece, Finland, Italy, Czech Republic, Hungary, Sweden, Austria, Belgium, Germany, The Netherlands, Spain, Romania, France) 3 %, Ireland 12 % and Luxembourg 13 %.
In Distributed Energy scenario, most of the countries show same results (no curtailment). Some countries increase their demand curtailment due to higher hydrogen production using methane (Czech Republic, Spain, Greece, Bulgaria) 1 %.
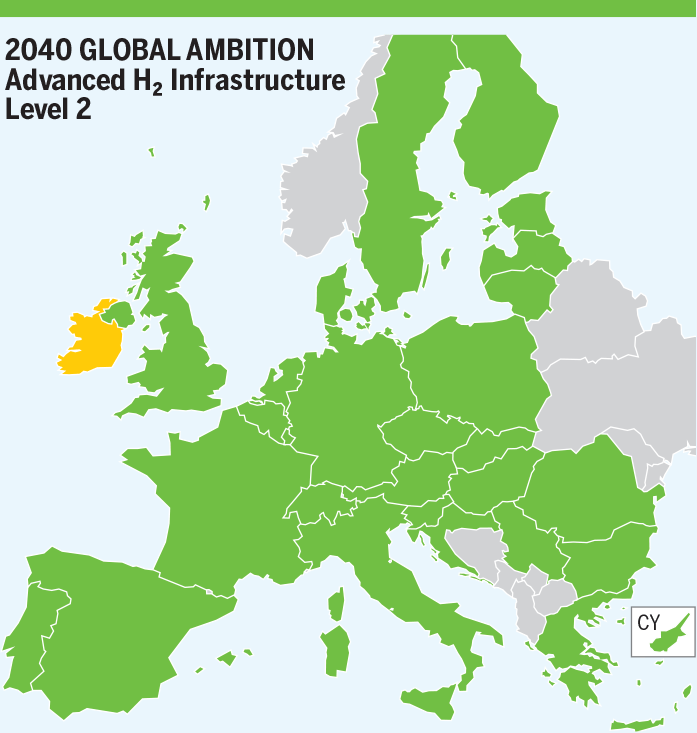
In Global Ambition scenario, most of the countries show same results (no curtailment). Some countries increase their demand curtailment due to higher hydrogen production using methane (Germany and Hungary) 1 % and Ireland 19 %.
- 2050
H₂ Infrastructure Level 1
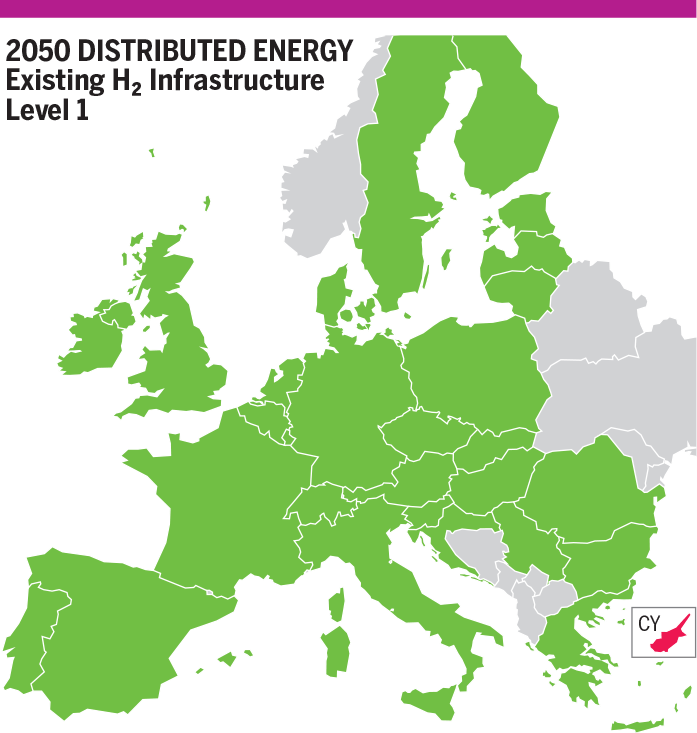
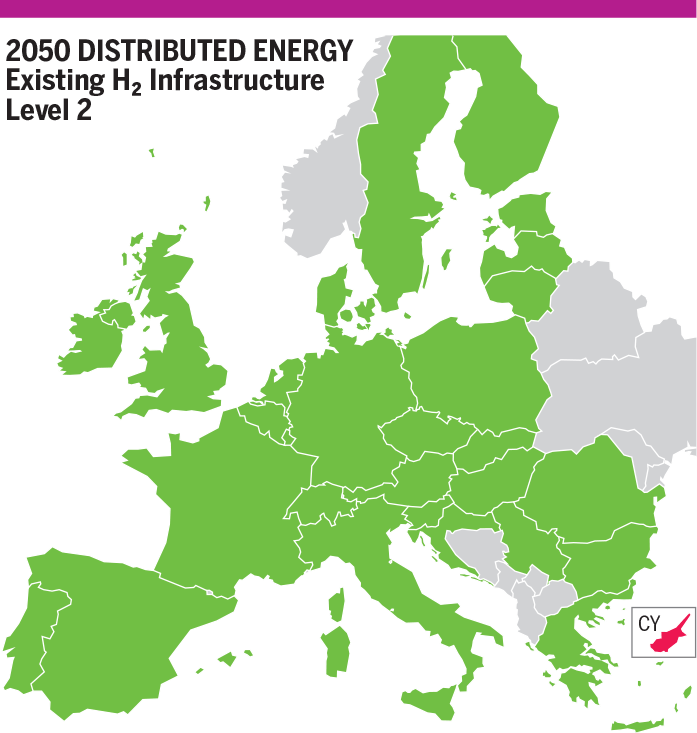
In Distributed Energy scenario, all countries show no impact on demand curtailment.
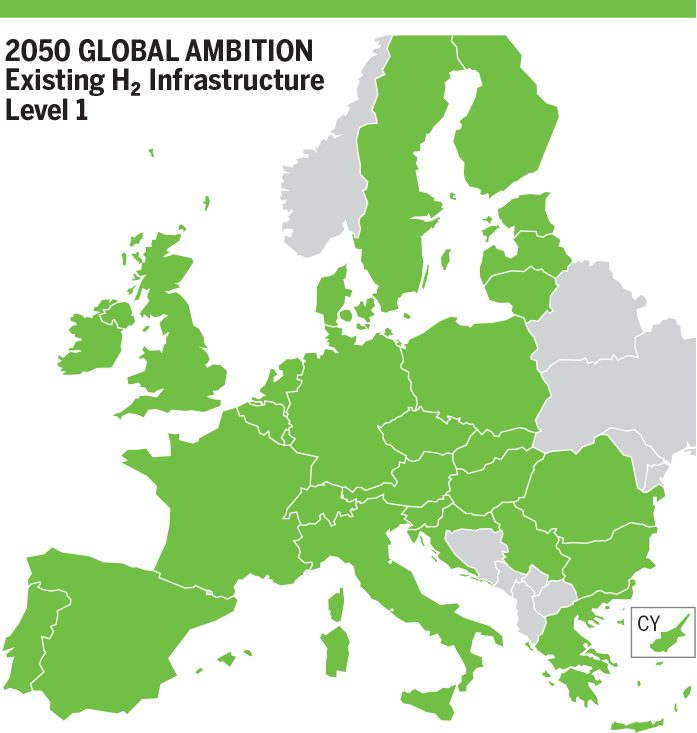
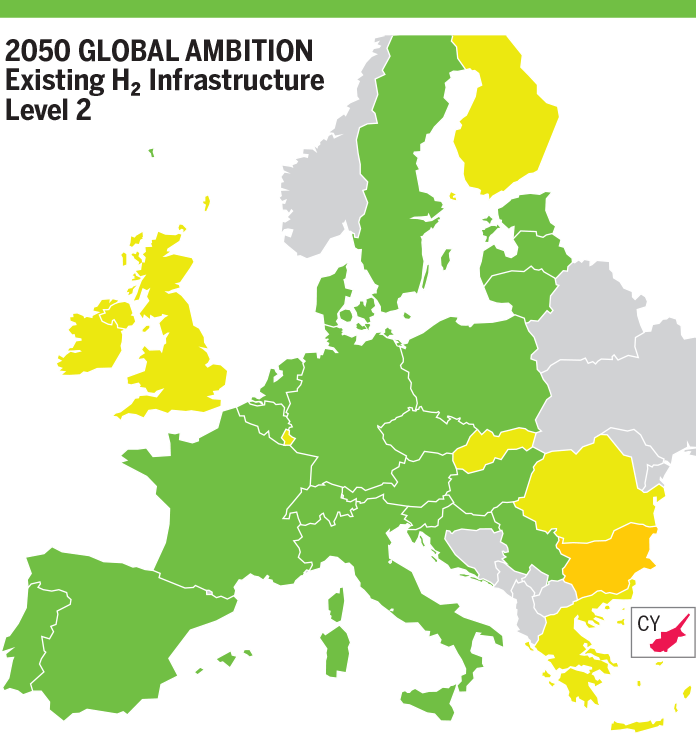
In Global Ambition scenario, all countries show no impact on demand curtailment.
H₂ Infrastructure Level 2
In Distributed Energy scenario, results remain unchanged.
In Global Ambition scenario, most of the countries show same results (no curtailment). Some countries increase their demand curtailment due to higher hydrogen production using methane (The Netherlands, Slovakia, Finland, United Kingdom) 1 %, Ireland 5 %, Luxembourg 7 %, Greece and Bulgaria 10 %.
SLID Hydrogen Results in CH₄ Existing Infrastructure – H₂ Infrastructure Level 1

Figure 13.7: Hydrogen SLID Results for Peak Demand in Existing CH₄ Infrastructure with H₂ Level 1
SLID Hydrogen Results in CH₄ Existing Infrastructure – H₂ Infrastructure Level 2

Figure 13.8: Hydrogen SLID Results for Peak Demand in Existing CH₄ Infrastructure with H₂ Level 2
13.5 Advanced Infrastructure level (Hydrogen Results)
H₂ Infrastructure Level 1
In infrastructure level 1, situation is improved in all scenarios and Years. Only Spain shows 1 % demand curtailment in 2030 in Global Ambition scenario.
- 2030
H₂ Infrastructure Level 2
In infrastructure level 2, situation remains unchanged for most scenarios and Years.
In Distributed Energy scenario, Ireland and Luxembourg show 28 % and 16 % demand curtailment due to higher hydrogen production using methane.
In Global Ambition scenario, Ireland, Luxembourg and Poland show respectively 34 %, 21 % and 1 % demand curtailment due to higher hydrogen production using methane.
- 2040
H₂ Infrastructure Level 2
In National Trends scenario, Ireland shows 13 % demand curtailment due to higher hydrogen production using methane.
In Global Ambition scenario, Ireland shows 19 % demand curtailment due to higher hydrogen production using methane.
- 2050
H₂ Infrastructure Level 2
In Global Ambition scenario, some countries show 1 % demand curtailment (Greece, Hungary, Austria, Czech Republic and Spain) United Kingdom 2 % and Ireland 7 % due to higher hydrogen production using methane.
SLID Hydrogen Results in CH₄ Advanced Infrastructure – H₂ Infrastructure Level 1

Figure 13.9: Hydrogen SLID Results for Peak Demand in Advanced CH₄ Infrastructure with H₂ Level 1
SLID Hydrogen Results in CH₄ Advanced Infrastructure – H₂ Infrastructure Level 2

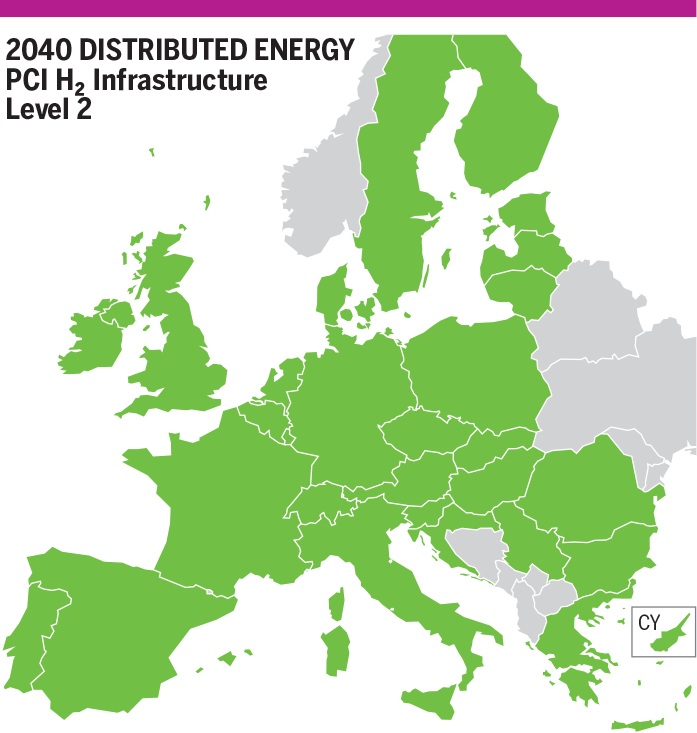
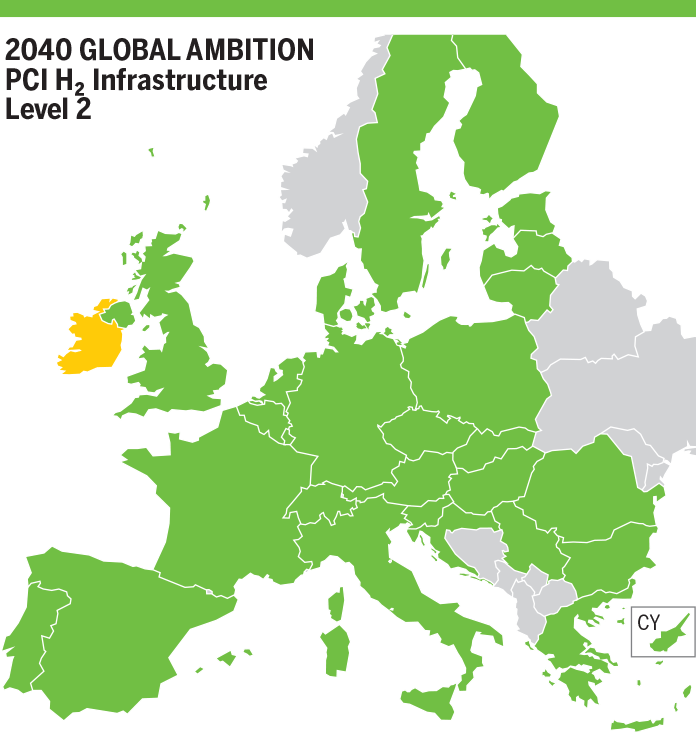
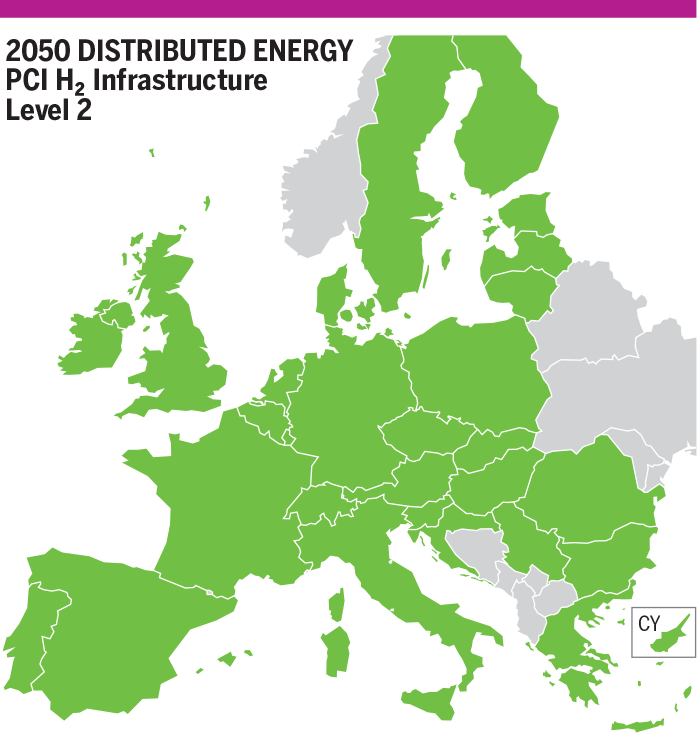
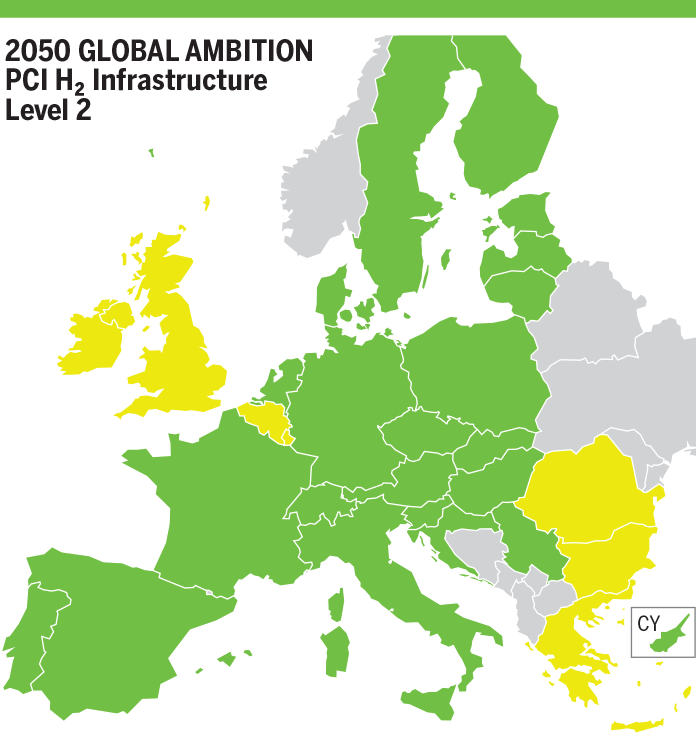
Figure 13.10: Hydrogen SLID Results for Peak Demand in Advanced CH₄ Infrastructure with H₂ Level 2
13.6 PCI Infrastructure level (Hydrogen Results)
H₂ Infrastructure Level 1
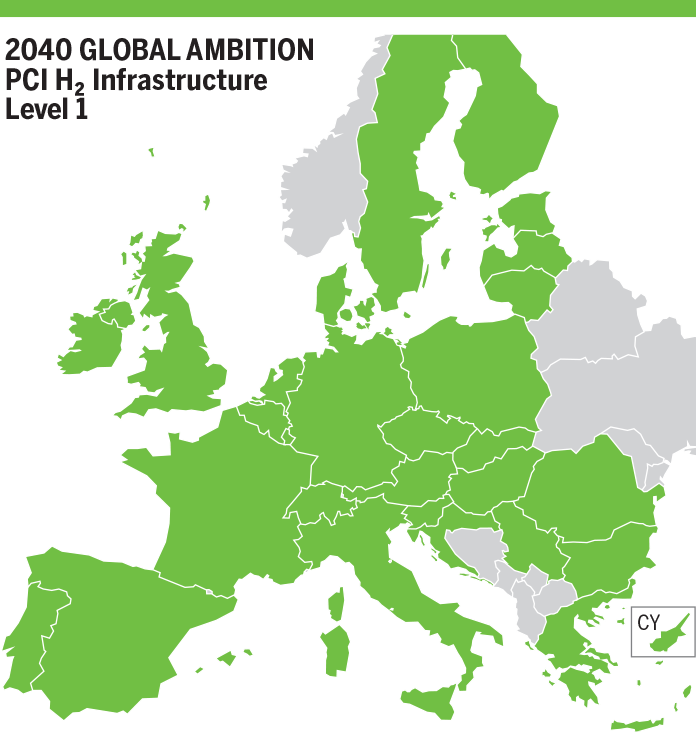
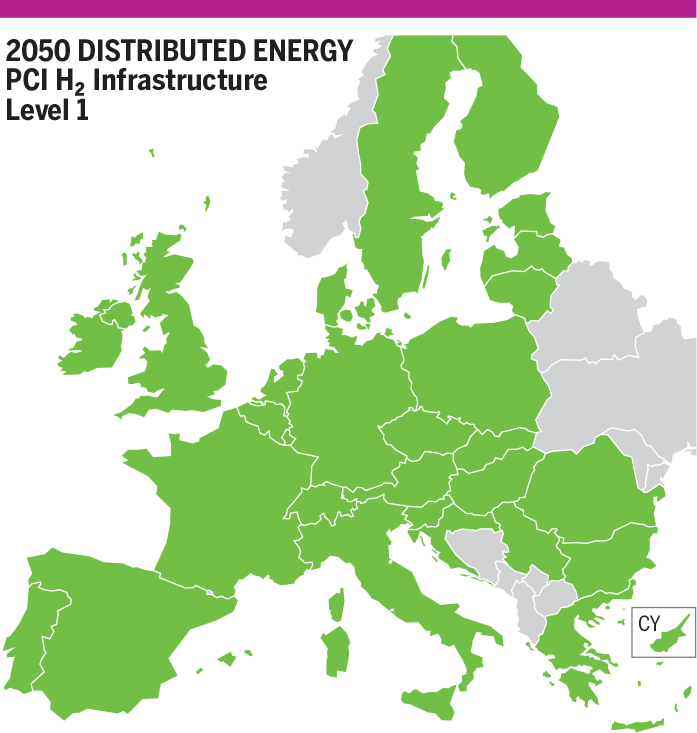
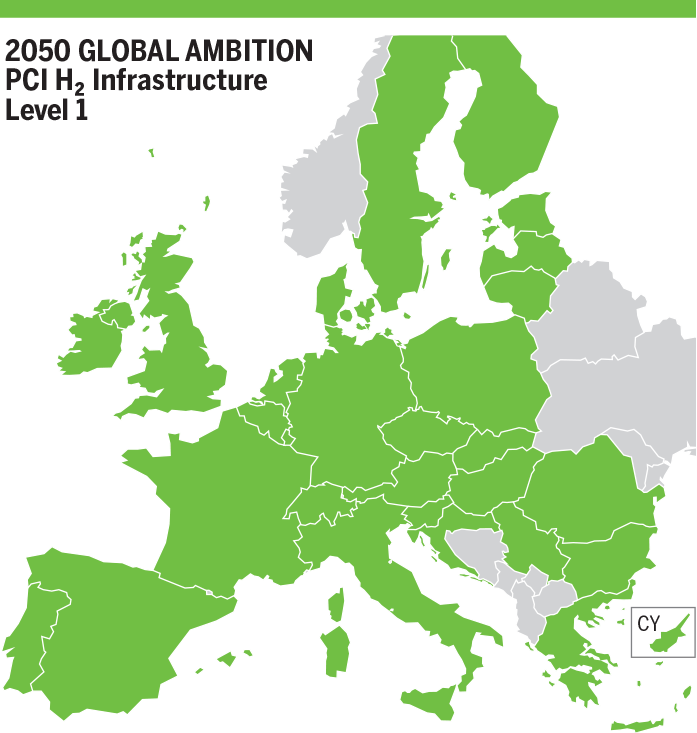
In H2 Infrastructure level 1, situation is improved in all scenarios and years. Only Spain shows 1 % demand curtailment in 2030 in Global Ambition scenario.
- 2025 – Best Estimate
H₂ Infrastructure Level 2
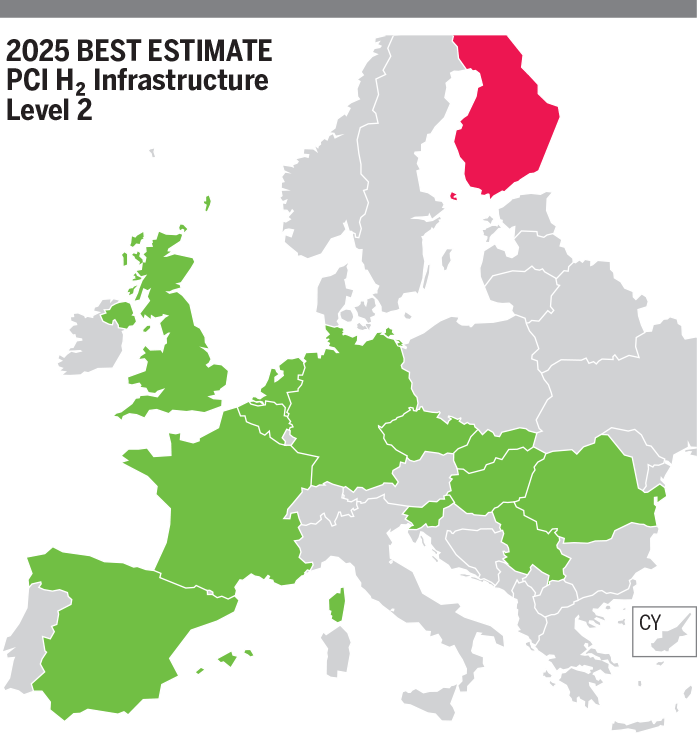
In Best Estimate scenario, only Finland shows now 33 % demand curtailment due to higher hydrogen production using methane and infrastructure limitation.
- 2030
H₂ Infrastructure Level 2
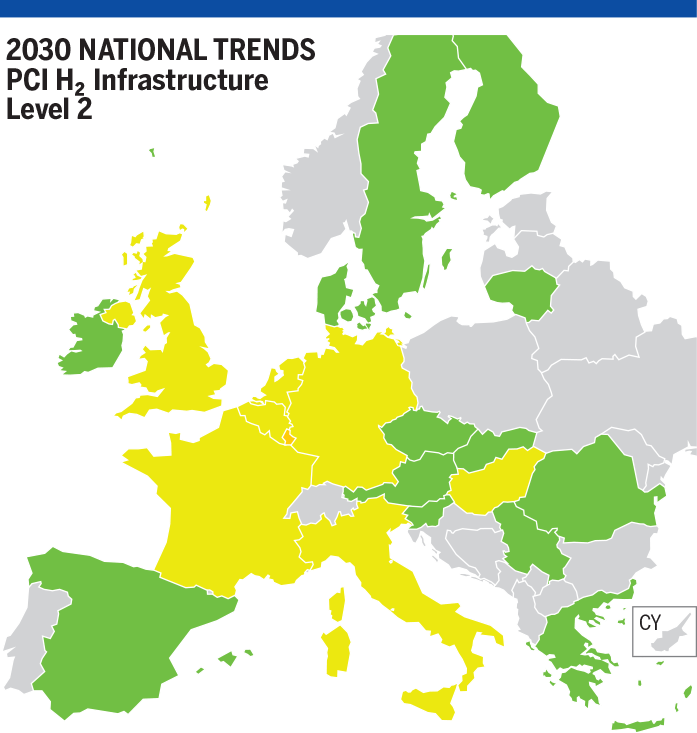
In National Trends scenario, results remain unchanged for most of the countries. Due to higher hydrogen production using methane, some countries increase their demand curtailment (Belgium, Hungary, Germany, The Netherlands, Italy, France) 2 %, United Kingdom 6 % and Luxembourg 17 %.
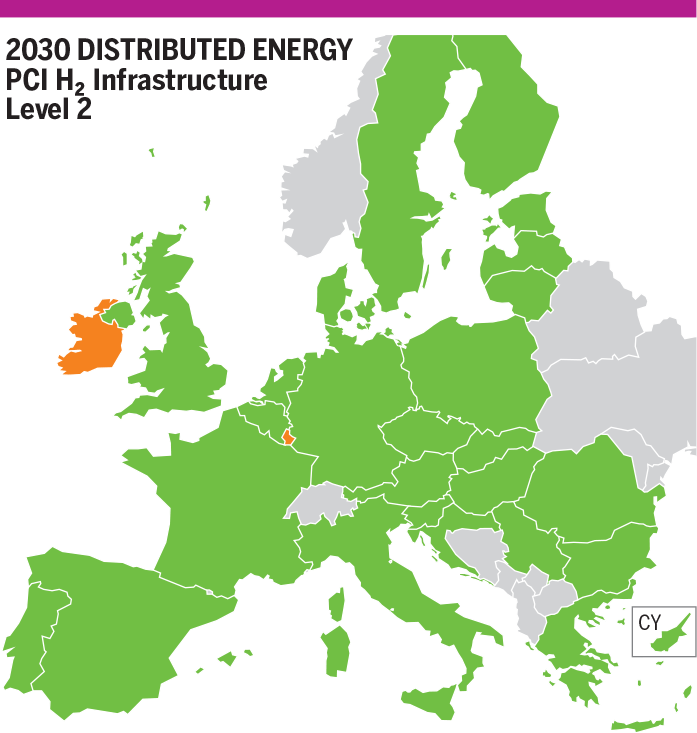
In Distributed Energy scenario, Ireland and Luxembourg show 28 % and 16 % demand curtailment due to higher hydrogen production using methane.
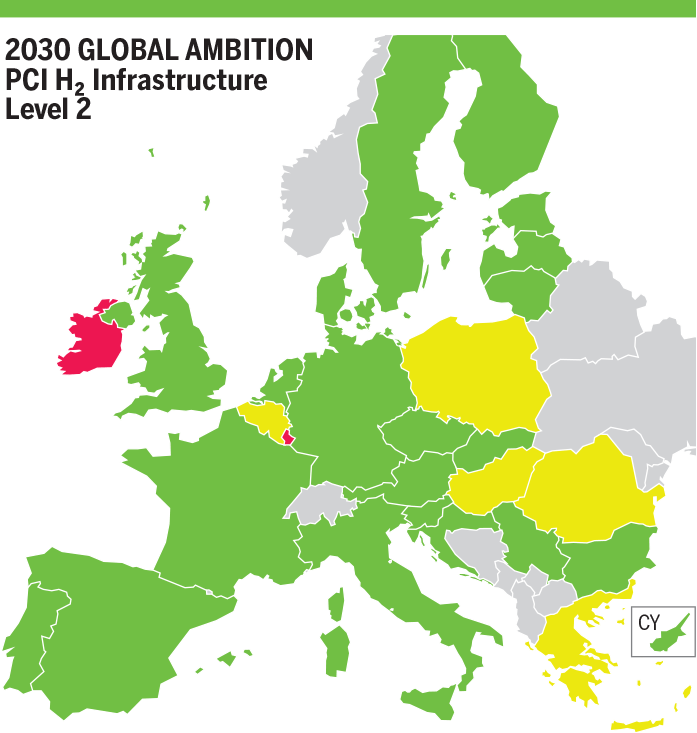
In Global Ambition scenario, Ireland and Luxembourg show respectively 34 % and 21 % demand curtailment and Belgium, Poland, Hungary, Romania and Greece show 1 % demand curtailment, due to higher hydrogen production using methane.
- 2040
H₂ Infrastructure Level 2
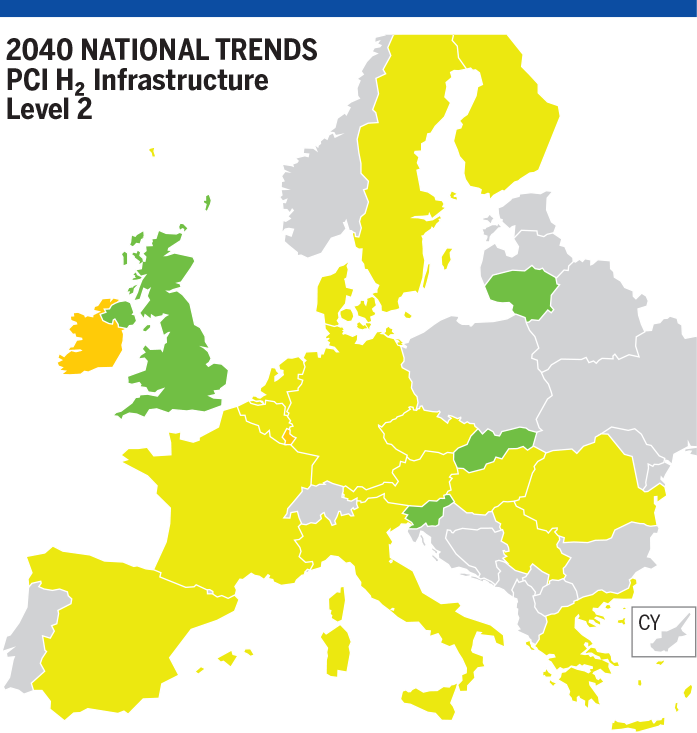
In National Trends scenario, most of the countries show now 4 % demand curtailment and Ireland 13 %. Situation remains unchanged for Lithuania, Slovakia, Slovenia and United Kingdom.
In Distributed Energy scenario, situation remains unchanged (no demand curtailment).
In Global Ambition scenario, Ireland shows now 19 % demand curtailment.
- 2050
H₂ Infrastructure Level 2
In Distributed Energy scenario, situation remains unchanged (no demand curtailment).
In Global Ambition scenario, some countries show 3 % demand curtailment (Greece, Romania and Bulgaria), Belgium 1 %, United Kingdom 2 % and Ireland 7 % due to higher hydrogen production using methane.
SLID Hydrogen Results in CH₄ PCI Infrastructure – H₂ Infrastructure Level 1

Figure 13.11: Hydrogen SLID Results for Peak Demand in PCI CH₄ Infrastructure with H₂ Level 1
SLID Hydrogen Results in CH₄ PCI Infrastructure – H₂ Infrastructure Level 2

Figure 13.12: Hydrogen SLID Results for Peak Demand in PCI CH₄ Infrastructure with H₂ Level 2


