Picture courtesy of Elering
7 Reference case1
1 All results and maps will be available through the visualization platform, including those with no curtailments
Simulation Results
ENTSOG focuses the simulations on network-related demand and supply depending on the data availability. It should be noted that the simulations done for yearly demand and high demand situations (2-week, 2-week dunkelflaute and design case) are independent from each other. The fact that the maximum supply from LNG tanks and underground storages is only allowed for the high demand situations, as described in Annex D, explains the possibility to reduce the curtailment observed in the yearly results.
As for the hydrogen system no existing infrastructure level is available yet, and ENTSOG has identified a possible hydrogen network based on the information provided by promoters in their project submission for the TYNDP/PCI process (i. e., H2 Infrastructure level). Therefore, the System Assessment shows the results that could be reached (for different timestamps) under the hypothesis of a full commissioning of the H2 infrastructure projects submitted by project promoters but not yet in place. Therefore, each time results show no H2 demand curtailment (e. g., Distributed Energy, average winter, 2030) these should not be read as an absence of H2 infrastructure needs for the given scenario. On the contrary, the full availability of the planned infrastructures composing the H2 Infrastructure level is assumed to avoid the potential demand curtailment.
Furthermore, the results are determined by the behaviour of the model, that does not factorise supply commercial agreements, and assumptions on infrastructure developments.
Moreover, results are also impacted by the demand and supply figures adopted that, in some specific cases, refer to scenarios that have been defined a few years ago (i. e., National Trends).
It should be noted that the scenario values for hydrogen were determined by an expansion model as explained in the TYNDP 2022 Scenario report and its accompanying documents. However, an interlinked model with the electricity grid was also run after the scenarios were built, using the actual H2 Infrastructure levels as well as the relevant electricity projects instead of the results of the expansion model that had delivered the scenario values. From these new simulations, the curves for hydrogen- and methane-fired power plants were retrieved as well as updated electrolytic hydrogen production values to maintain consistency with the electricity TYNDP. However, the location of the hydrogen production as well as its distribution over the year can also thereby change. This can affect the optimal specifications of the European hydrogen infrastructure.
7.1 Yearly Demand
7.1.1 Methane Results
7.1.1.1 Existing Methane Infrastructure
There is no risk of methane demand curtailment in any scenario except for Bosnia and Herzegovina. The results show an infrastructure limitation (i. e., bottleneck) between Serbia and Bosnia Herzegovina in all years and scenarios.
In 2030 in the National Trends scenario, Germany and Czech Republic show 1 % and 3 % of demand curtailment respectively due to infrastructure limitations with other interconnected countries, not among themselves.
7.1.1.2 Advanced and PCI Infrastructure for methane
The risk of demand curtailment still exists in the PCI infrastructure level for Bosnia and Herzegovina but it is fully mitigated with the Advanced infrastructure level.
7.1.2 Hydrogen Results
In 2025 there is no hydrogen infrastructure considered in any of the two infrastructure levels (no difference between levels 1 and 2), and some European countries have no demand to satisfy.
7.1.2.1 Existing Methane Infrastructure
In H₂ Infrastructure Level 2, demand curtailment is fully mitigated in all years and scenarios, due to the upgraded hydrogen infrastructure , allowing for higher imports and better cooperation, and to additional hydrogen production using methane.
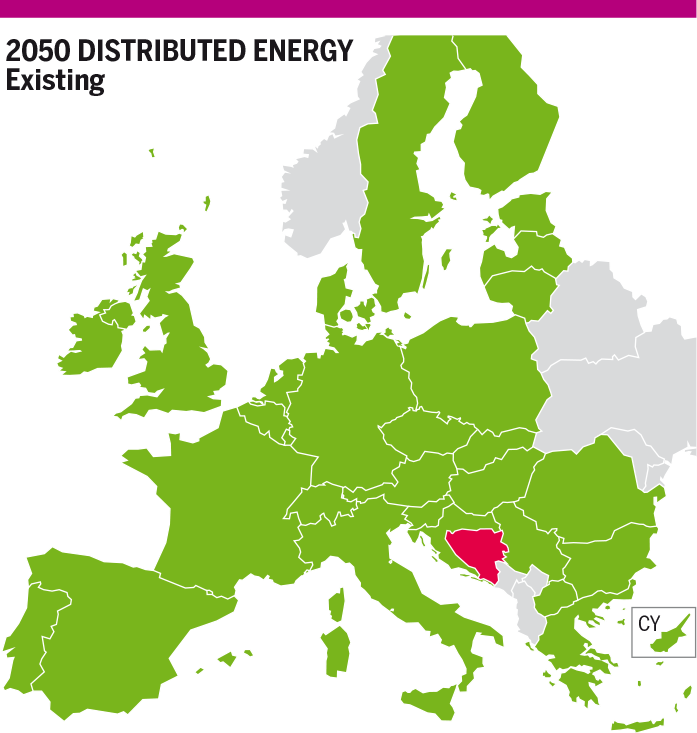
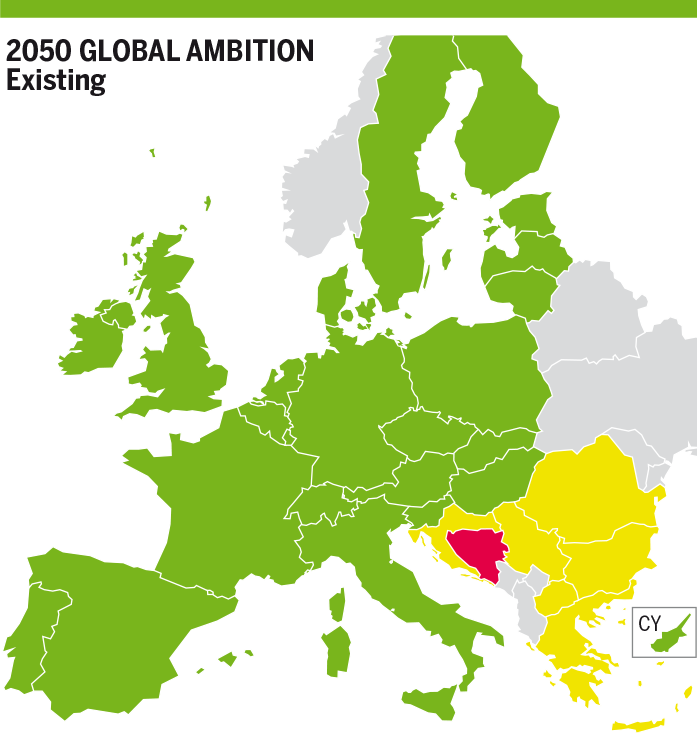
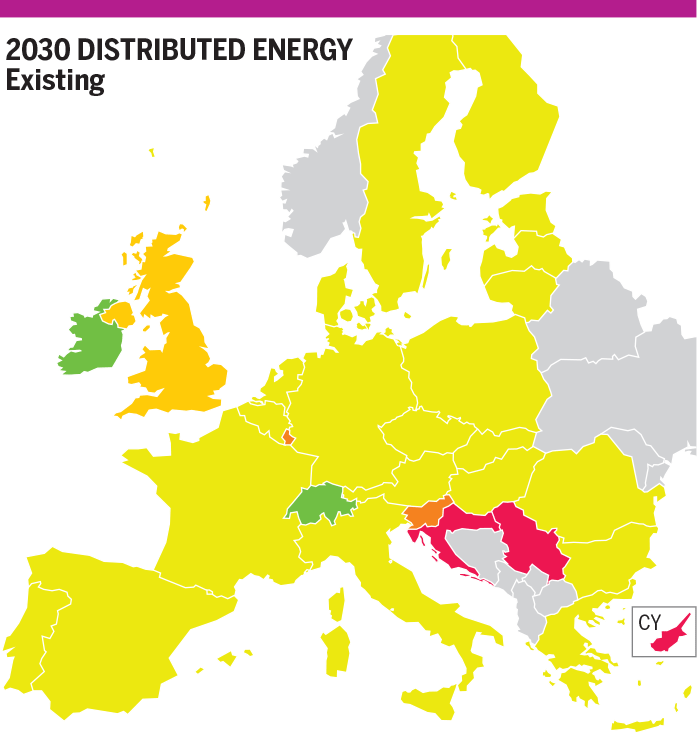
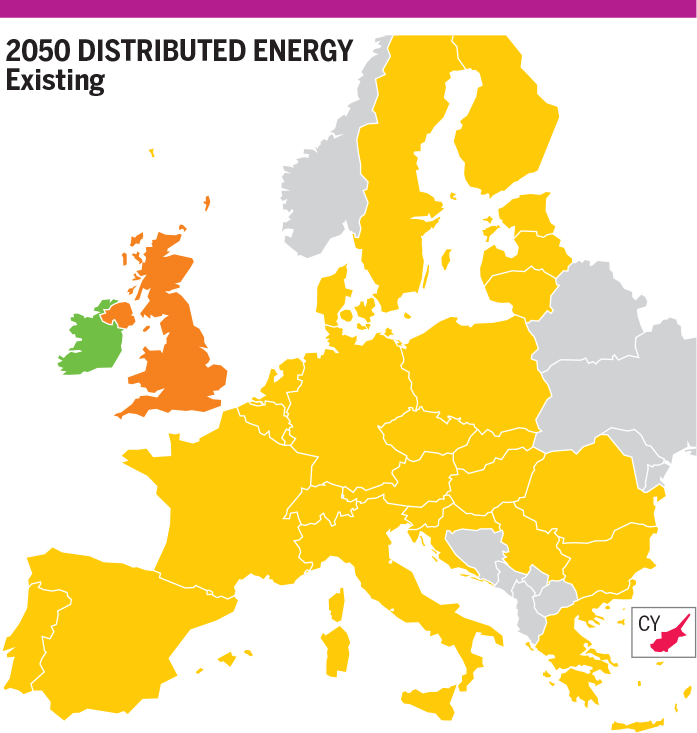
The latter allows for the indirect usage of methane storages to satisfy the seasonal hydrogen demand. In these cases, the crucial role of dedicated hydrogen storages is mitigated. Therefore, only results for the H₂ Infrastructure Level 1 are described in figure 7.1.
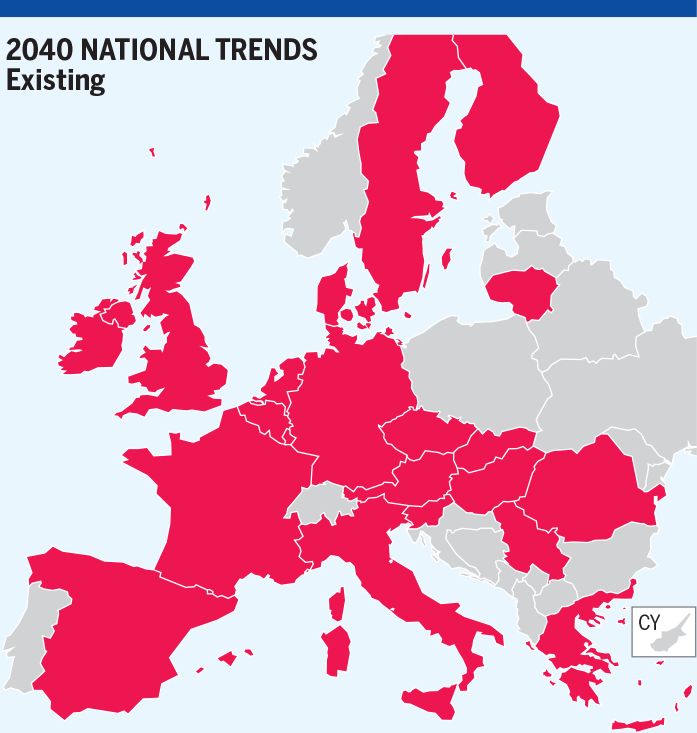
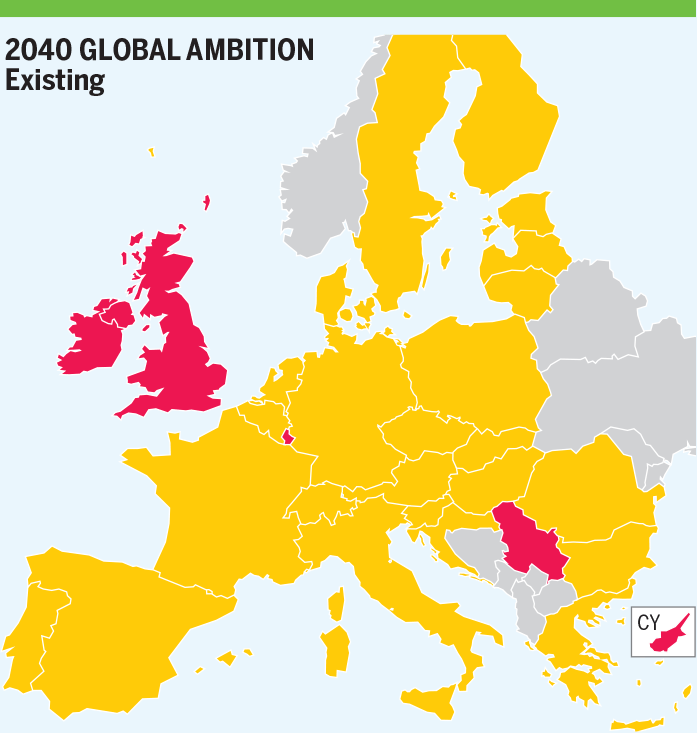
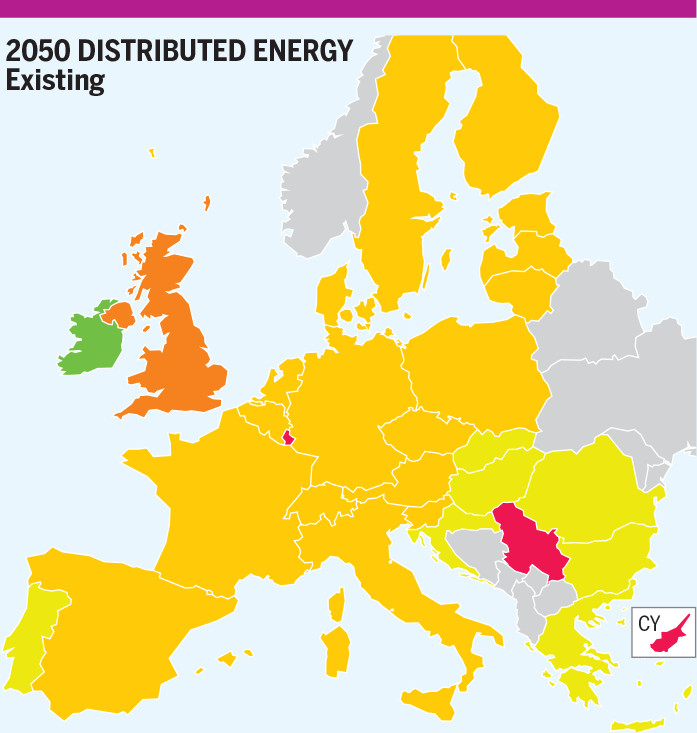
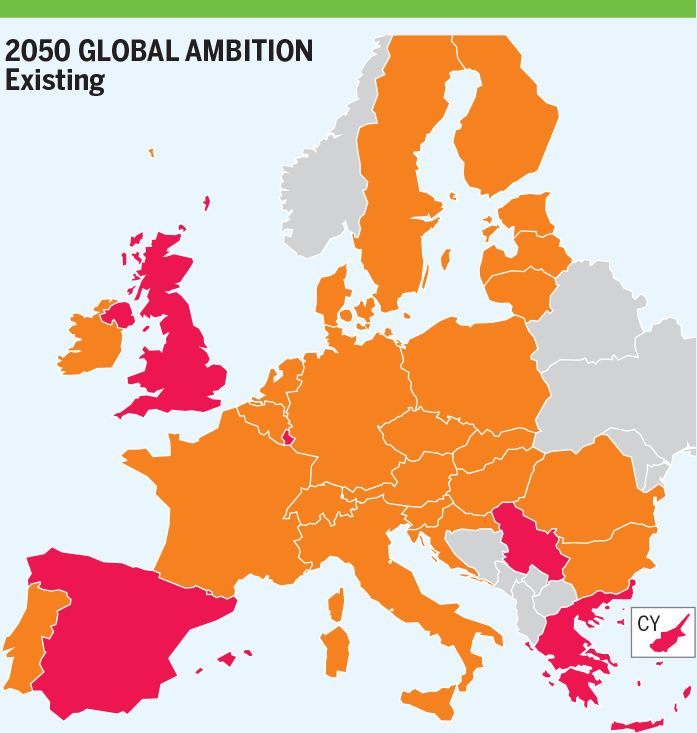
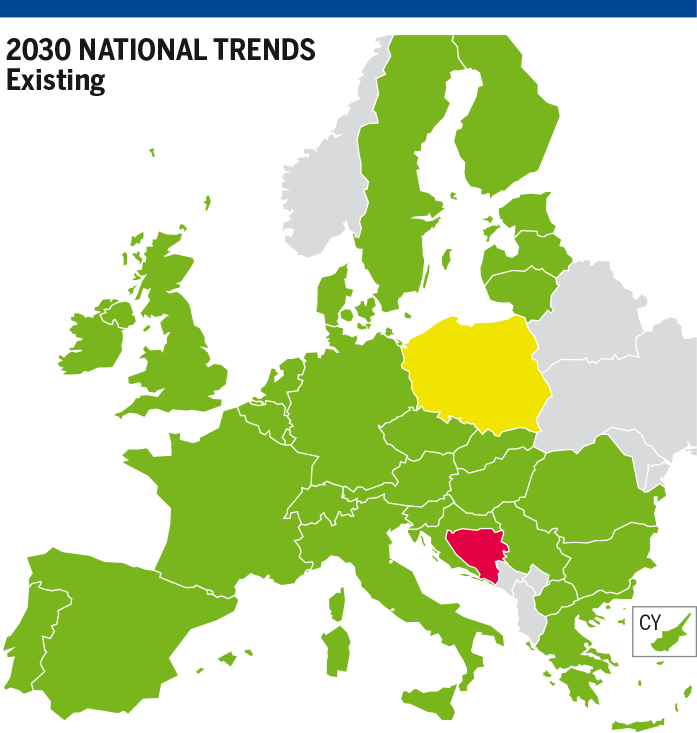
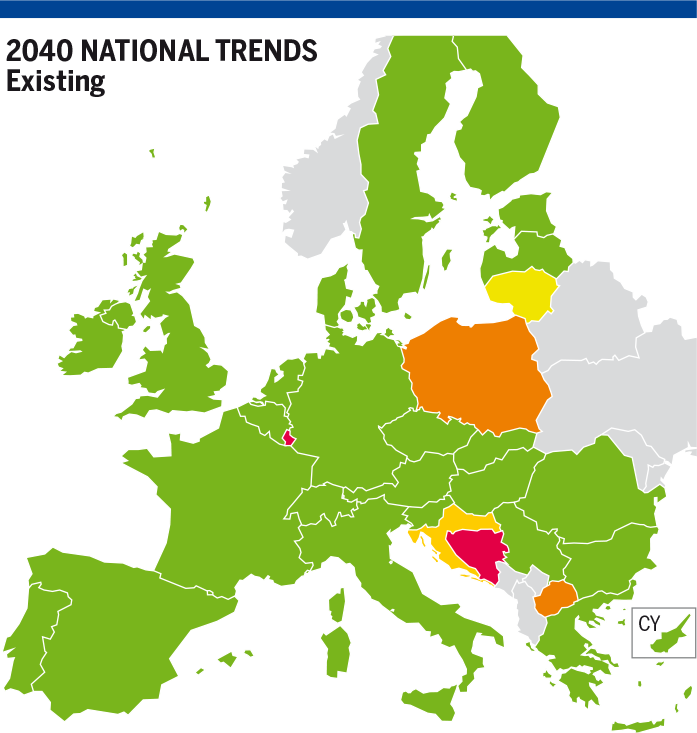
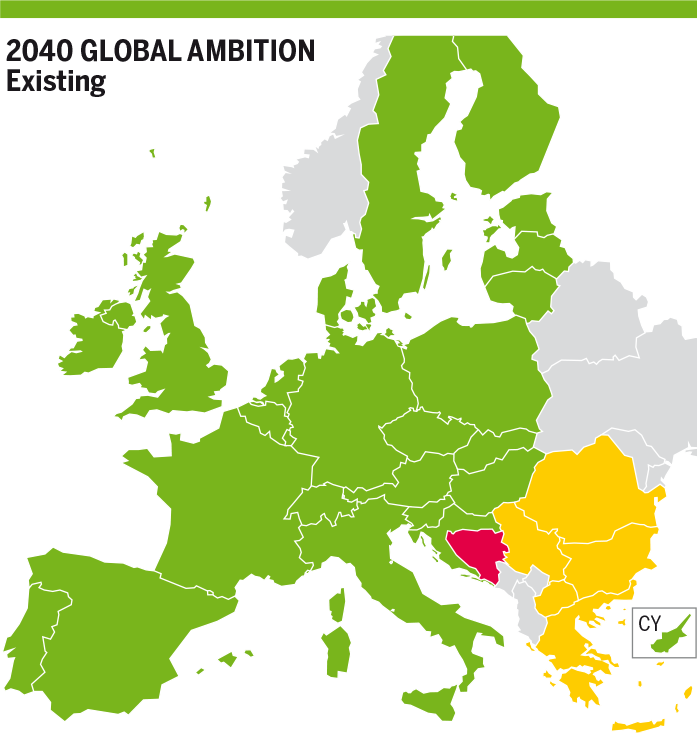
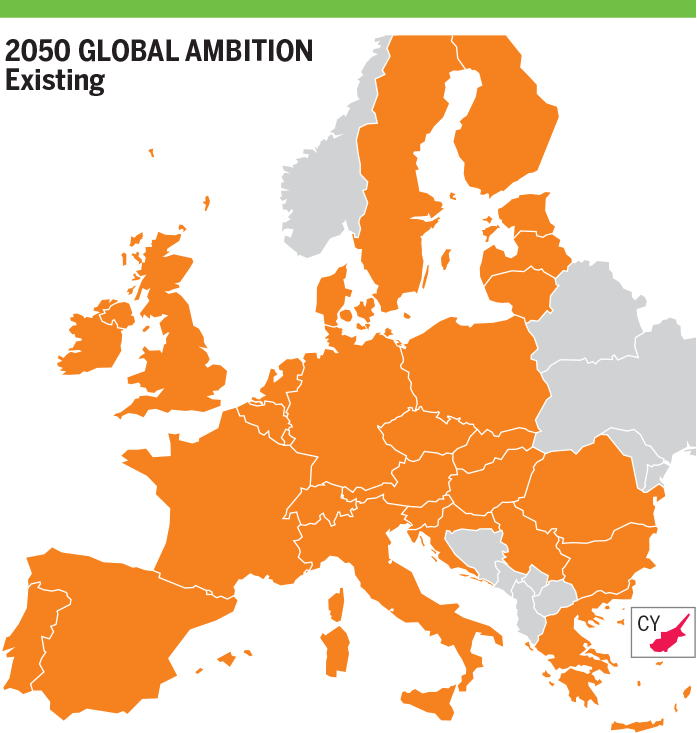
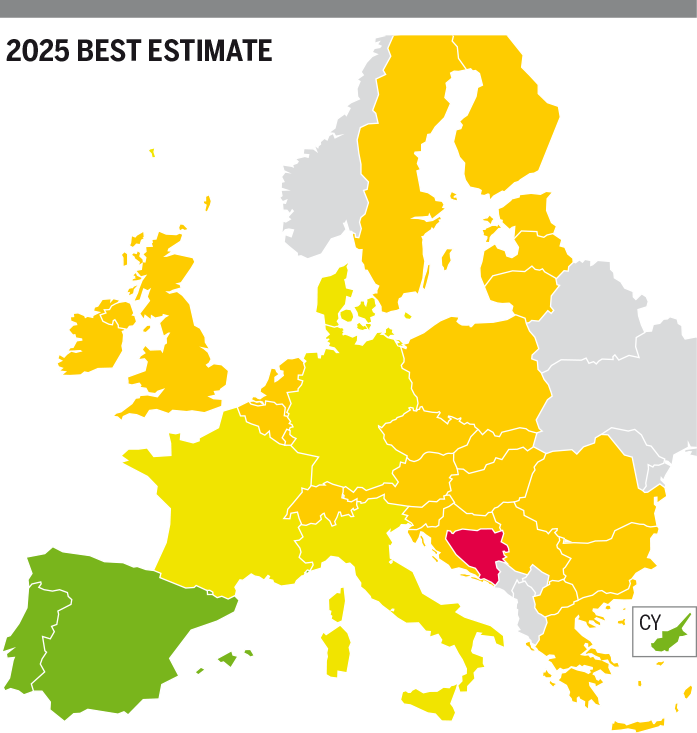
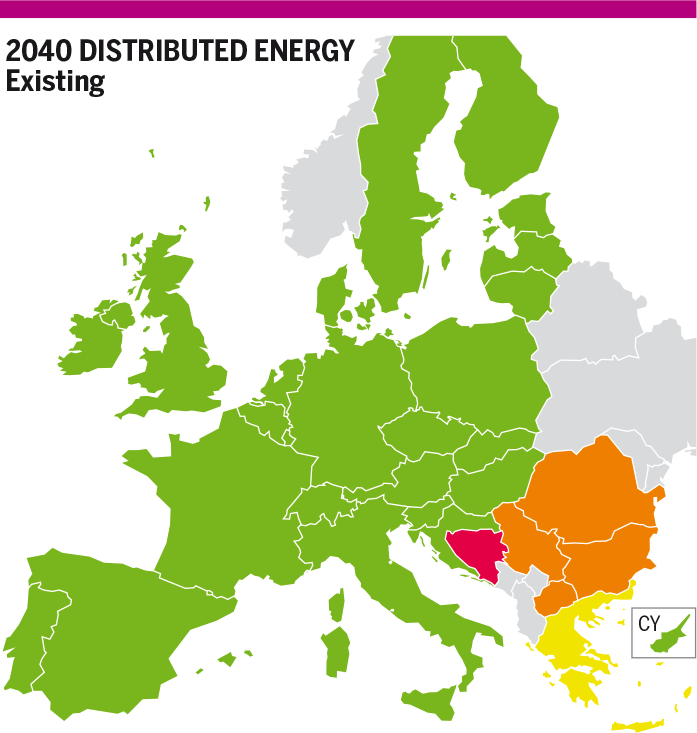
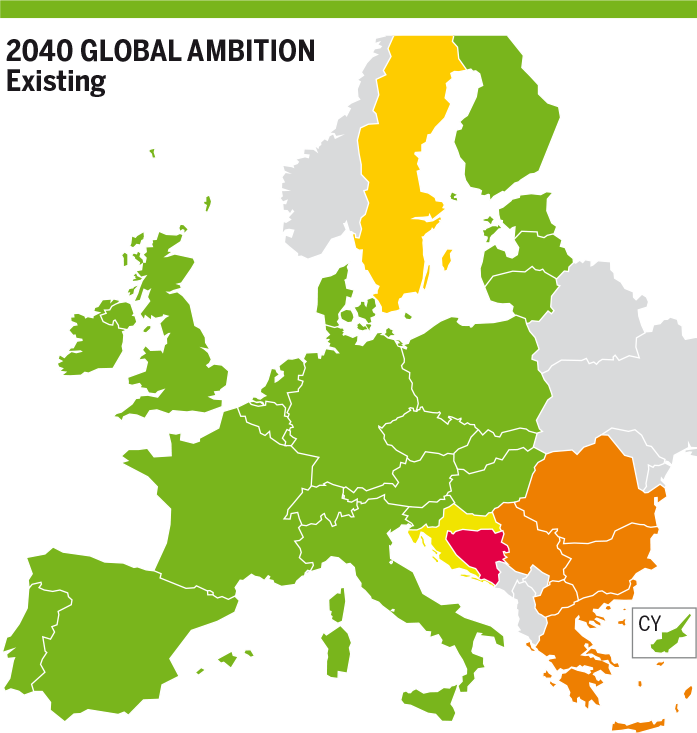
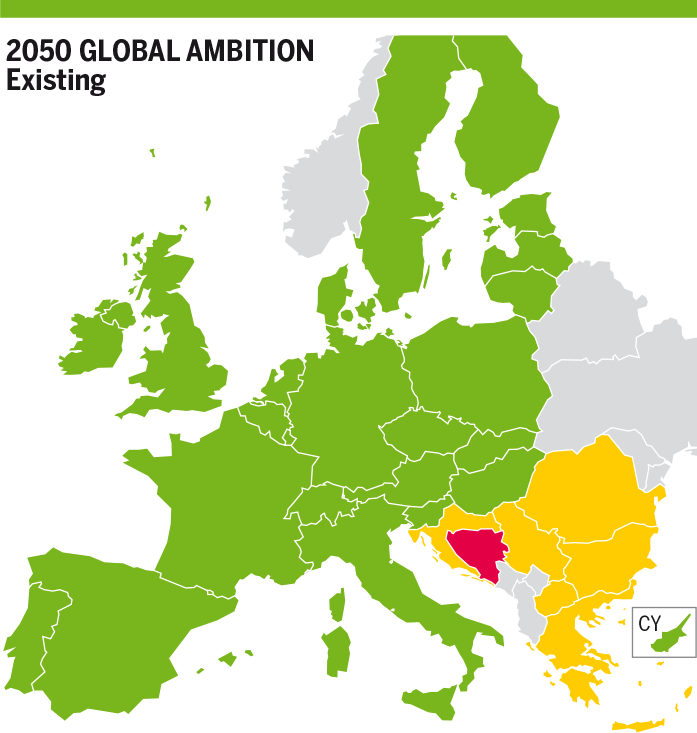
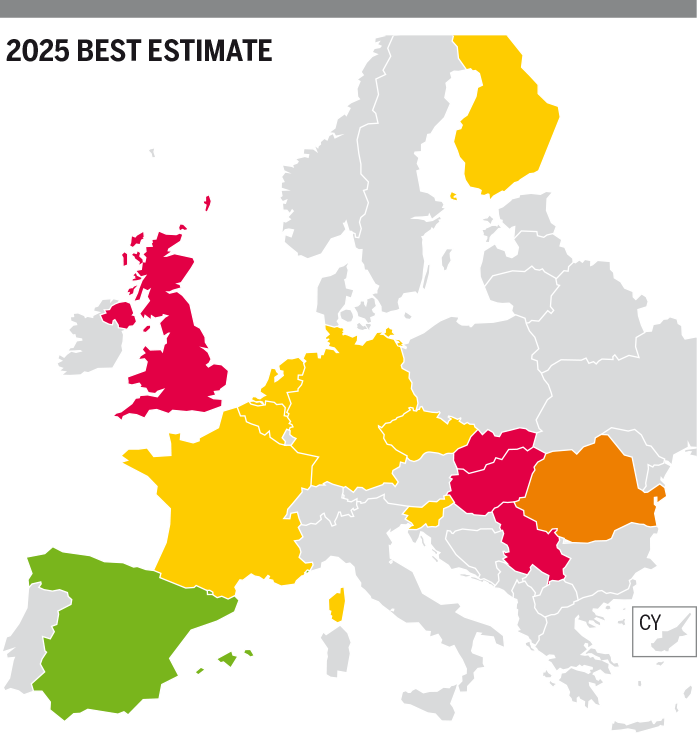
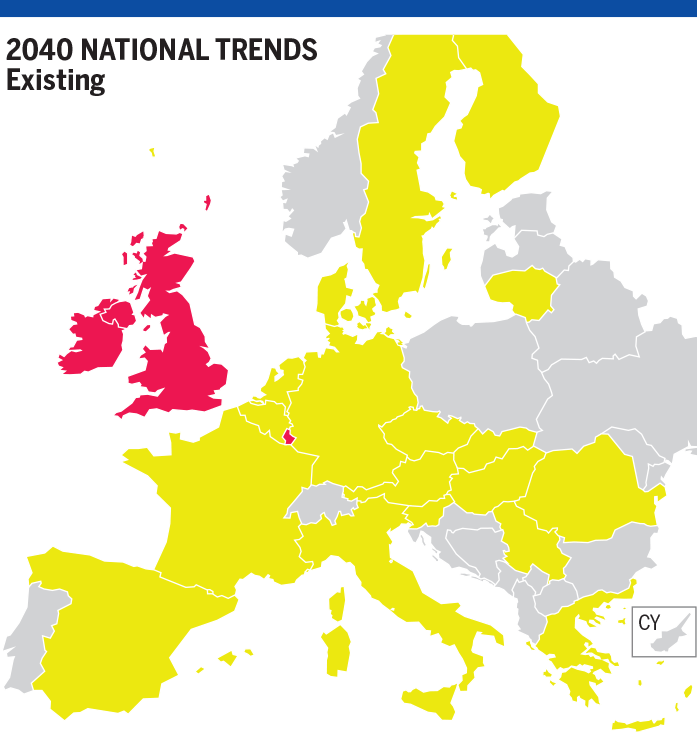
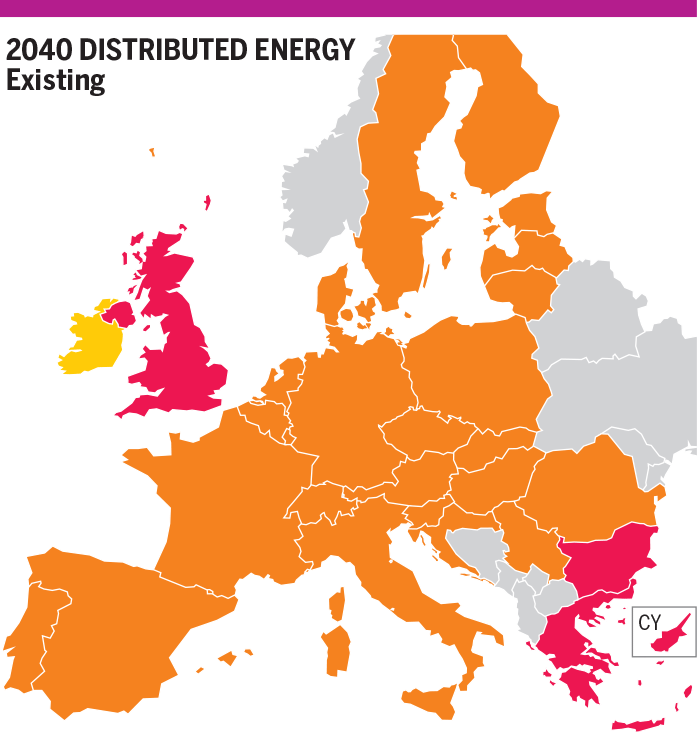
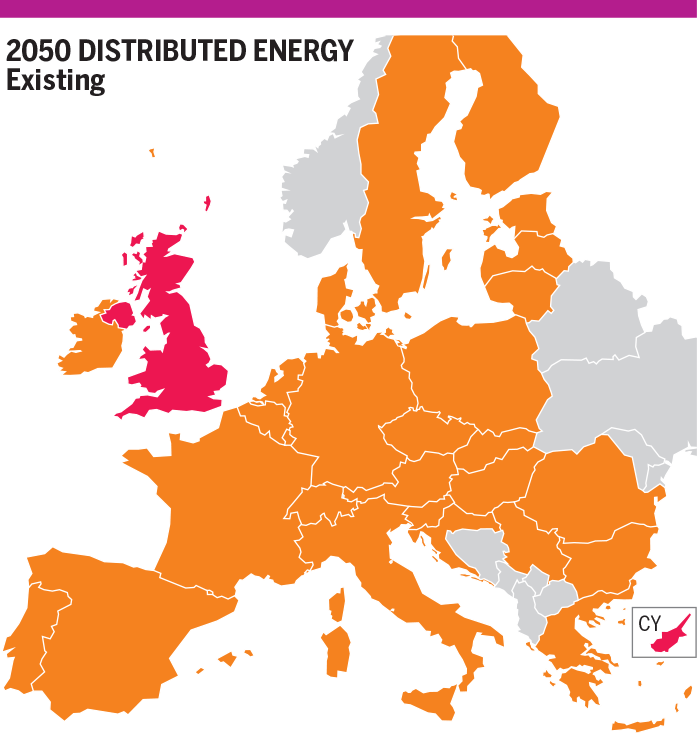
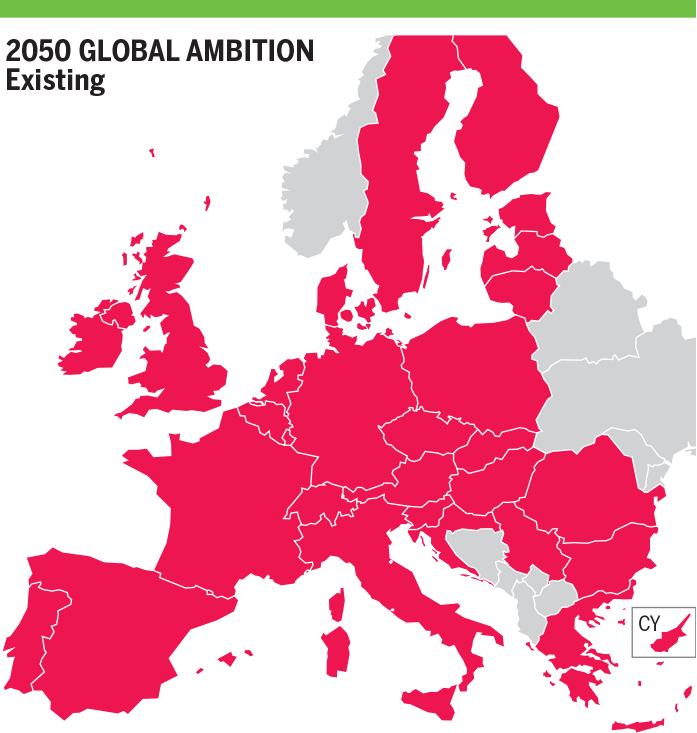
Figure 7.1: Hydrogen Results for Yearly Demand in Existing CH₄ Infrastructure and H₂ Level 1
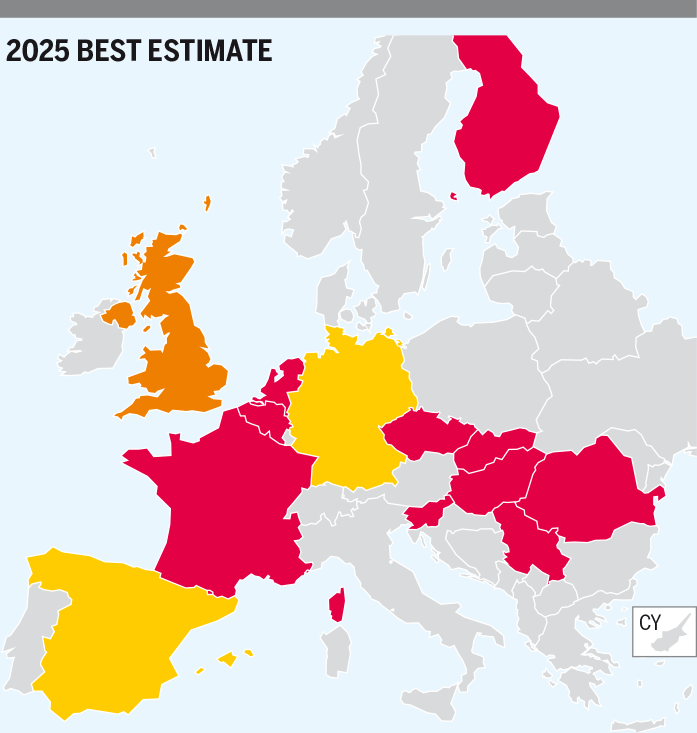


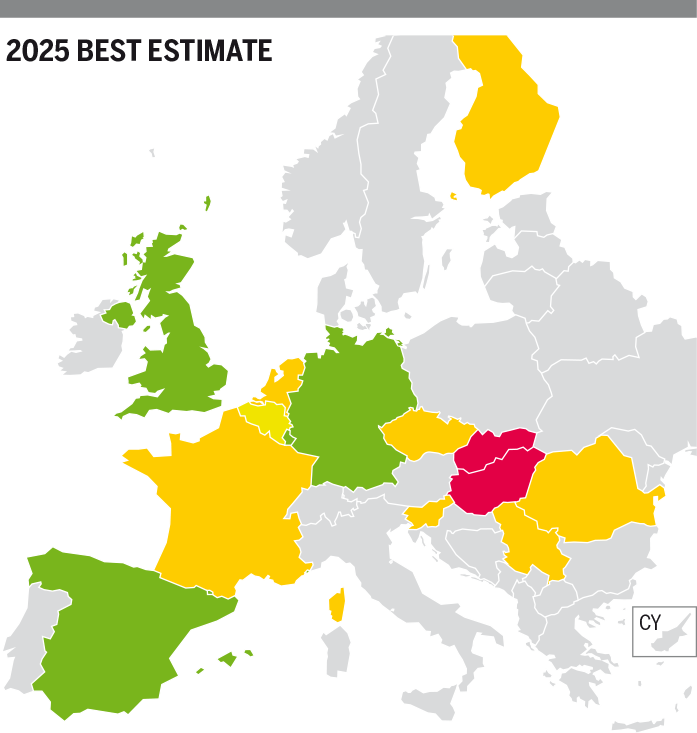
- 2025 – Best Estimate
H₂ Infrastructure Level 1
In Best Estimate scenario, there is a hydrogen demand curtailment in countries with hydrogen demand. The hydrogen production of these countries does not satisfy their demand and there is no infrastructure for cooperation between countries.
The following hydrogen demand curtailment rates could therefore be observed: Spain and Germany (15 %), United Kingdom (29 %), Czech Republic (91 %), Belgium (94 %), Hungary (96 %), Slovenia, Slovakia, The Netherlands (98 %), Latvia, Finland, France, Serbia and Romania (100 %).
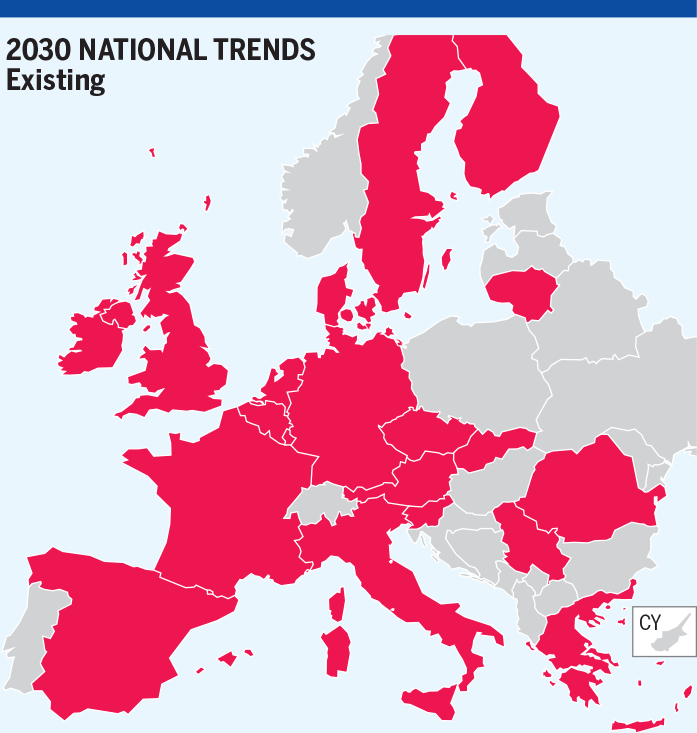
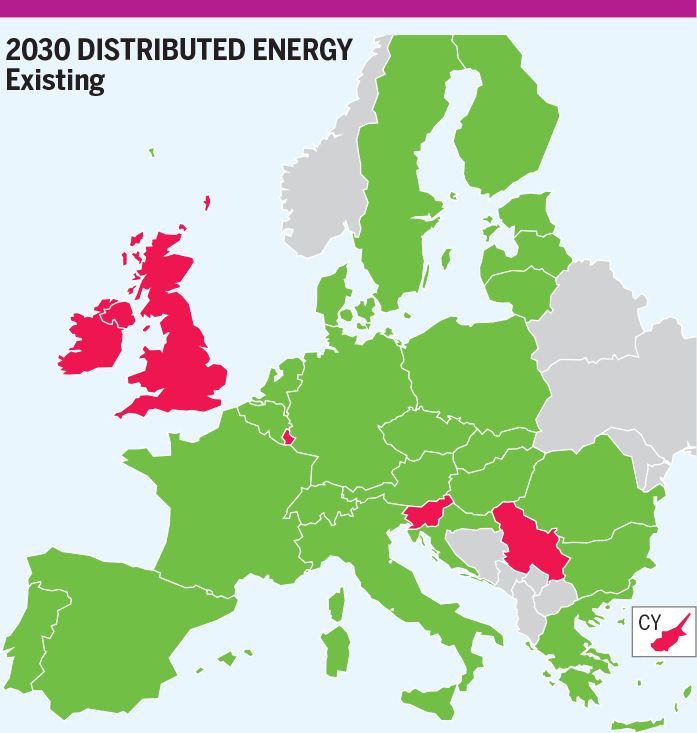
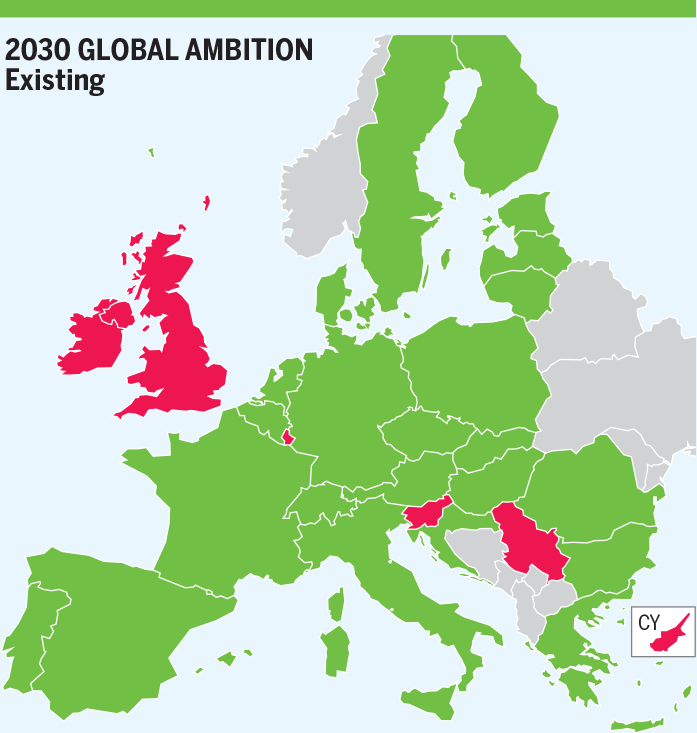
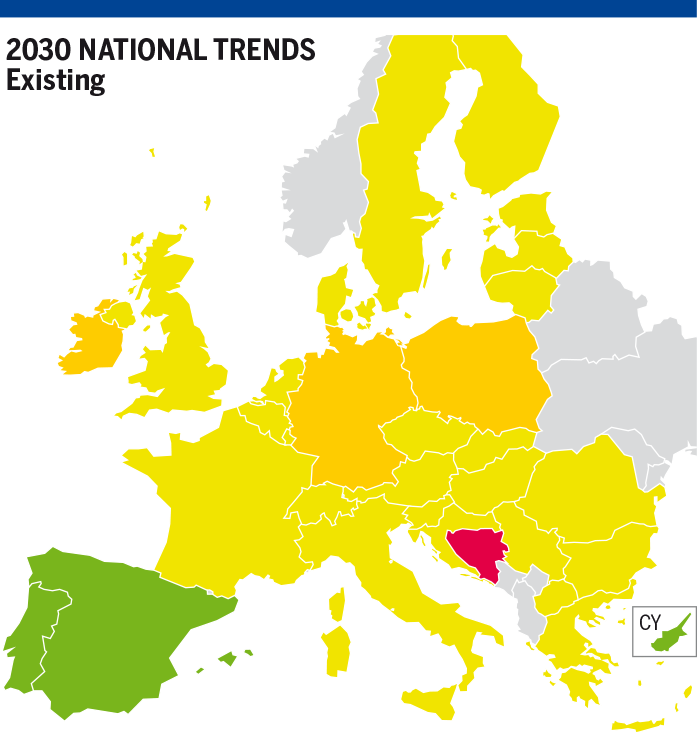
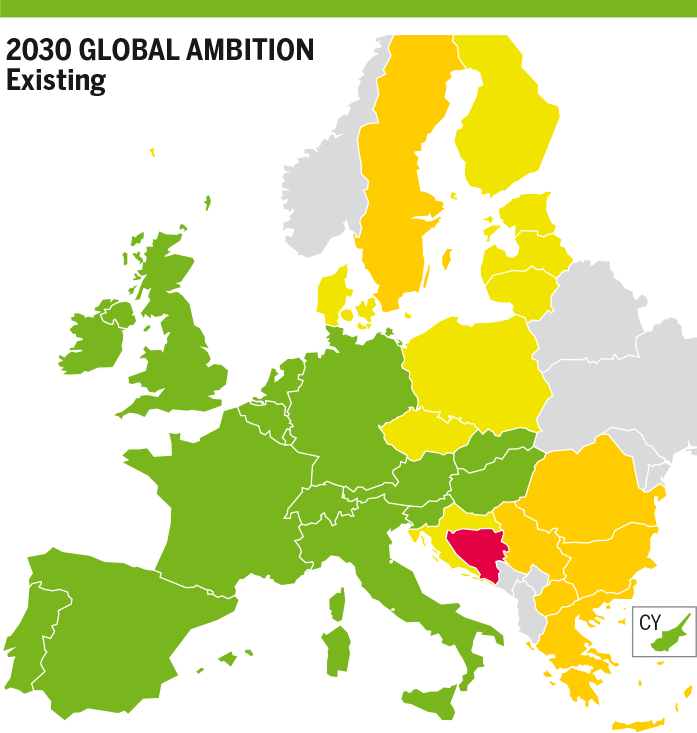
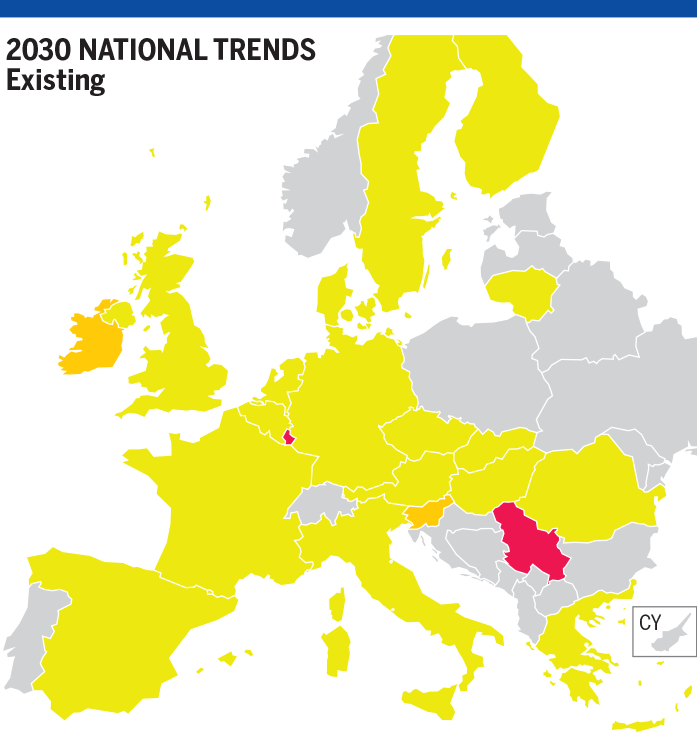
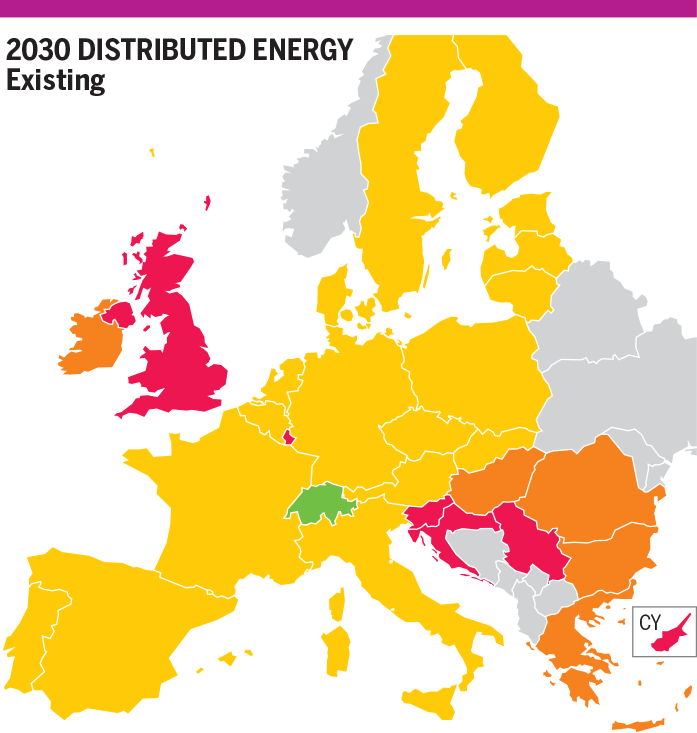
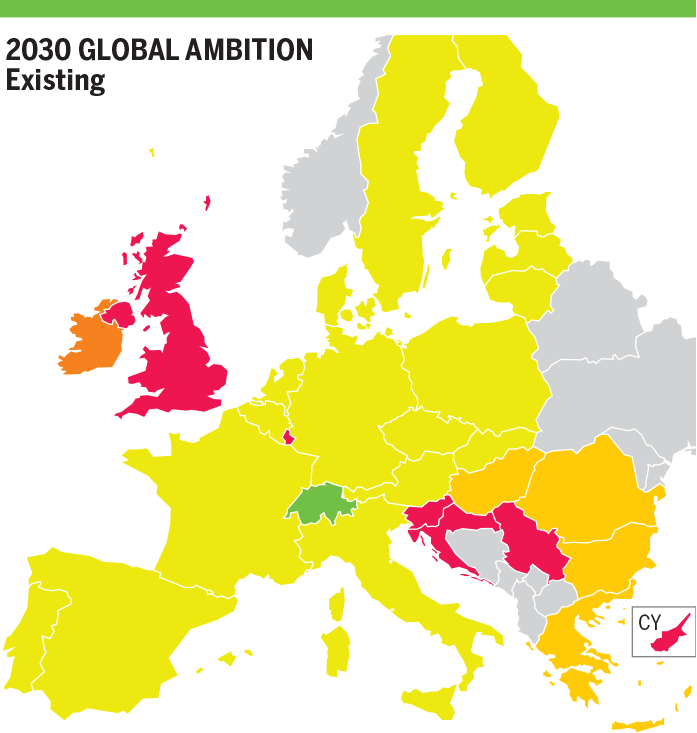
- 2030
H₂ Infrastructure Level 1
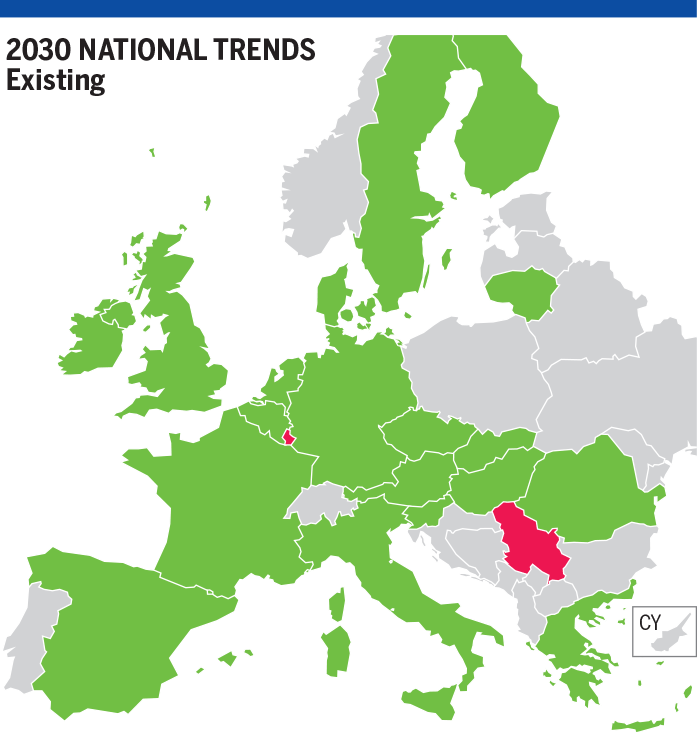
In National Trends scenario, all countries with hydrogen demand show hydrogen demand curtailment. The hydrogen infrastructure allows cooperation between countries and demand curtailment is mitigated without any infrastructure limitations. Most countries show 63 % hydrogen demand curtailment. Some countries are not interconnected and show different hydrogen demand curtailment values: Slovenia (58 %), United Kingdom (86 %), Ireland (96 %) and Luxembourg (98 %).
In Distributed Energy scenario, assuming the commissioning of all the planned H2 infrastructure there is no risk of hydrogen demand curtailment in most of the countries due to hydrogen imports from Norway, North Africa, Ukraine, and via Liquefied Hydrogen and SMR contribution (40 GWh/d). The following countries show hydrogen demand curtailment due to missing interconnections with neighbouring countries: United Kingdom (46 %), Ireland (33 %), Luxembourg (61 %), Slovenia (86 %), Croatia (1 %) and Serbia (100 %). Their own hydrogen production cannot satisfy their demand.
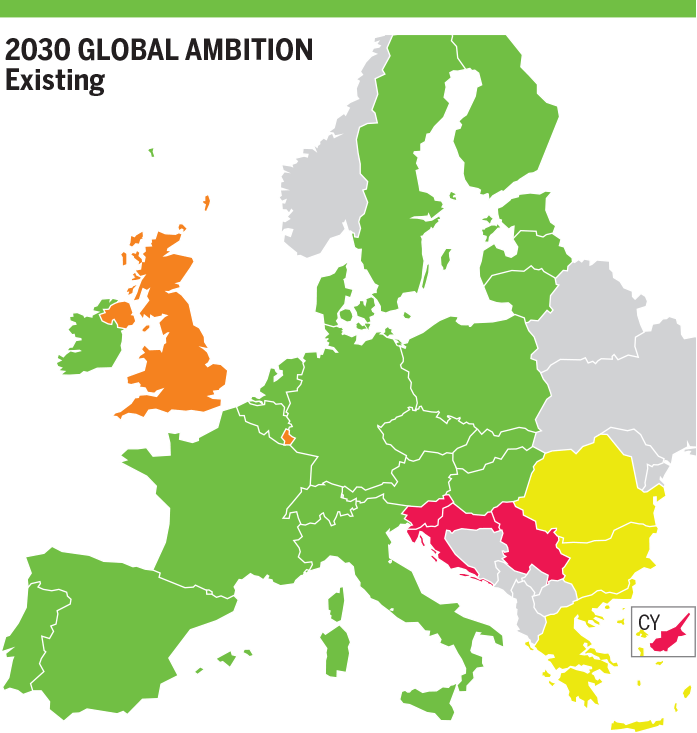
In Global Ambition scenario, assuming the commissioning of all the planned H2 infrastructure there is no risk of hydrogen demand curtailment in most of the countries due to hydrogen import from Norway, North Africa, Ukraine and via Liquefied Hydrogen and SMR contribution (68 GWh/d). The following countries show hydrogen demand curtailment due to missing interconnections with neighbouring countries: United Kingdom (46 %), Ireland (37 %), Luxembourg (55 %), Slovenia (89 %) and Serbia (100 %). Their own hydrogen production cannot satisfy their demand.
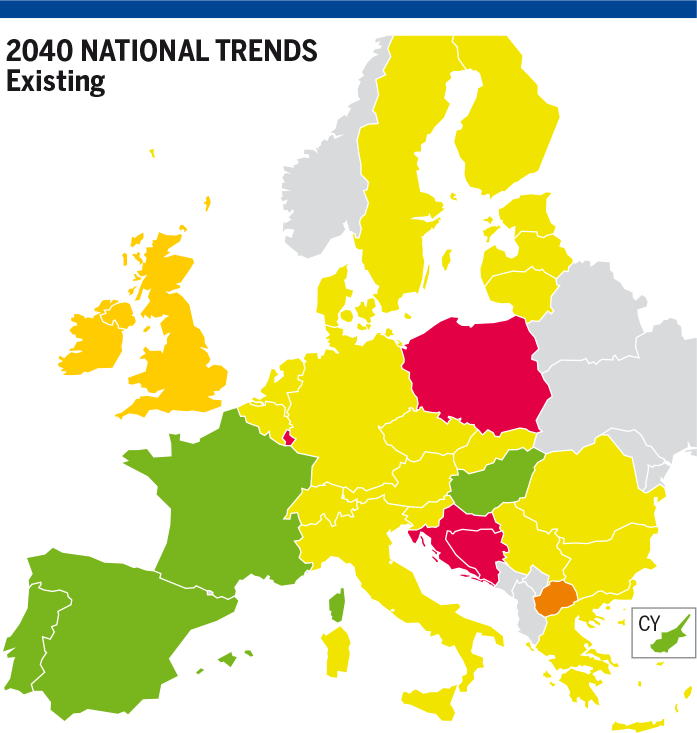
- 2040
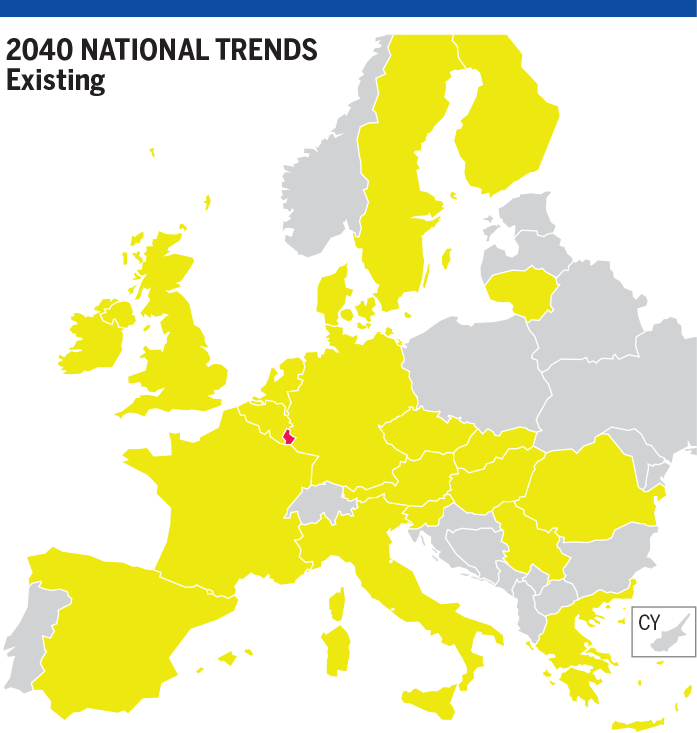
The curtailed demand that occurs for the observed scenarios in 2040 under normal conditions requires further explanation. For this TYNDP, a monthly granularity is used in the ENTSOG System Assessment simulations. Thus, a displayed average curtailment rate for a country can be potentially caused by curtailments of a shorter duration than a full year.
The main reason for curtailed demand thereby is the seasonality of hydrogen demand and electrolytic hydrogen production. This seasonality cannot be sufficiently buffered by hydrogen import infrastructure or hydrogen storages. More details are given for the individual scenarios.
H₂ Infrastructure Level 1
In National Trends scenario, all countries with hydrogen demand show demand curtailment. The hydrogen infrastructure allows cooperation between most countries and hydrogen demand curtailment is then mitigated in a cooperative manner. Thus, these countries all show 54 % of hydrogen demand curtailment. The Netherlands shows 57 % demand curtailment since Belgium and Germany cannot cooperate further due to infrastructure limitations. Some countries are not interconnected and therefore show different hydrogen demand curtailment values: Slovenia (53 %), United Kingdom (94 %), Ireland (80 %) and Luxembourg (98 %).
In Distributed Energy scenario, despite the import of hydrogen and hydrogen production through SMR, most of the countries show 2 % to 5 % hydrogen demand curtailment. Hydrogen import options are only during the winter used at the maximum value allowed by infrastructure limitations. In other seasons, the import is significantly reduced compared to its infrastructure limits due to the preferential production of electrolytic hydrogen within the EU. In winter, the seasonally decreased electrolytic hydrogen production plus the hydrogen imports cannot satisfy the seasonally increased demand. Thus, in most countries the curtailment is observed only in the winter months. This situation could be at least partially mitigated by additional storage capacity since then more hydrogen could be imported along the year. Ireland is not connected with other countries and can satisfy its demand with its own production. Other countries that are not interconnected show different levels of hydrogen demand curtailment: United Kingdom (67 %), Luxembourg (83 %) and Serbia (100 %).
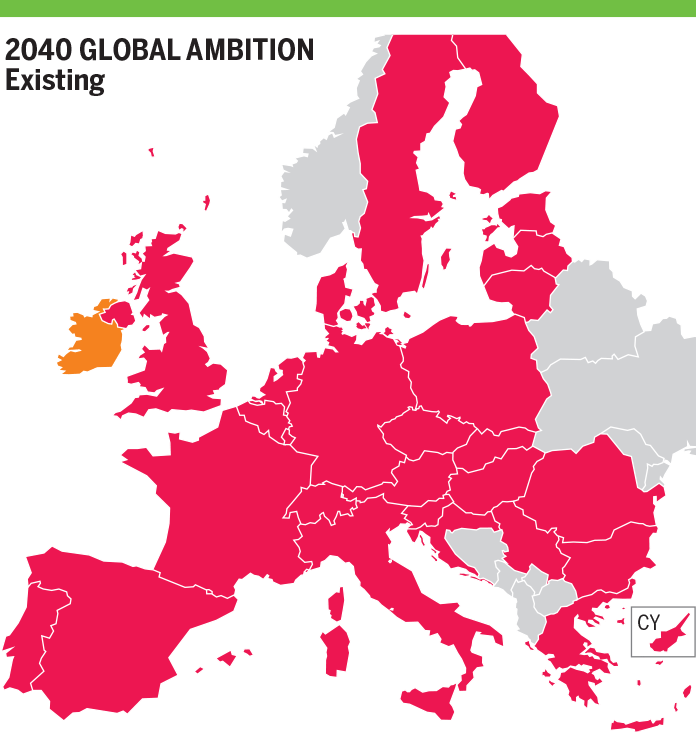
In Global Ambition scenario, with less hydrogen production all countries show demand curtailment. Most countries show 12 % of hydrogen demand curtailment. All hydrogen import options are used at a stable value that is as high as allowed by infrastructure limitations. However, the electrolysers cannot produce sufficient additional hydrogen in winter months, when lower electrolytic hydrogen production meets increased hydrogen demand, causing curtailment. This situation could be partially mitigated by additional hydrogen storages. The Baltic states (Lithuania, Latvia and Estonia) show 14 % of hydrogen demand curtailment and cannot cooperate more with Poland and the rest of the European Union’s Member States due to an infrastructure limitation between Lithuania and Poland.
- 2050
H₂ Infrastructure Level 1
In Distributed Energy scenario, all countries show hydrogen demand curtailment. Only Ireland with its own hydrogen production can satisfy its demand. Most countries show 15 % of hydrogen demand curtailment. The demand is curtailed during autumn and winter since seasonally increased hydrogen demand meets seasonally decreased electrolytic hydrogen production and maxed-out infrastructure that serves hydrogen imports. However, during summer and spring, more hydrogen could be imported if more storage capacity was available. The Eastern countries (Greece, Bulgaria, Slovakia, Croatia, Hungary and Romania show 4 % hydrogen demand curtailment and cannot cooperate more with interconnected countries due to infrastructure limitations. Portugal shows 6 % hydrogen demand curtailment and cannot cooperate more with Spain to mitigate its demand curtailment due to an infrastructure limitation between Portugal and Spain. Some countries that are not interconnected show higher hydrogen demand curtailments: United Kingdom (26 %), Luxembourg (87 %) and Serbia (100 %).
In Global Ambition scenario, all countries show hydrogen demand curtailment during the whole year. Ireland with its own hydrogen production shows 22 % hydrogen demand curtailment. The curtailment rate is elevated in winter compared to summer due to the seasonality of hydrogen demand and electrolytic supply while all import routes are used at their technical limit all the year. Most countries show 27 % hydrogen demand curtailment. Greece and Bulgaria show respectively 37 % and 29 % hydrogen demand curtailment. Infrastructure limitations do not allow Romania to mitigate demand curtailment in Bulgaria, while this reason limits Bulgaria to assist Greece. Spain shows 32 % hydrogen demand curtailment and Portugal and France cannot mitigate demand curtailment in Spain due to infrastructure limitations between France and Spain and from Portugal and Spain. It should be noted that the scenarios do not take into account the latest governmental agreements between Portugal, Spain, France, and Germany that envisage the Iberian Peninsula to be an exporter of hydrogen. Some countries that are not interconnected show higher hydrogen demand curtailments: United Kingdom (45 %), Luxembourg (91 %) and Serbia (100 %).
7.1.2.2 Advanced and PCI Infrastructure levels for methane
The situation remains unchanged in all years and demand scenarios compared to the existing methane infrastructure level. Additional flexibility on the methane infrastructure does not allow to produce more hydrogen using methane as hydrogen production using methane is capped to the scenario-based values when modelling the H₂ Infrastructure Level 1.
7.2 2-Week Cold Spell Demand
7.2.1 Methane Results
7.2.1.1 Existing Methane Infrastructure
Figure 7.2: Methane Results for 2W Demand in Existing CH₄ Infrastructure and H₂ Level 1
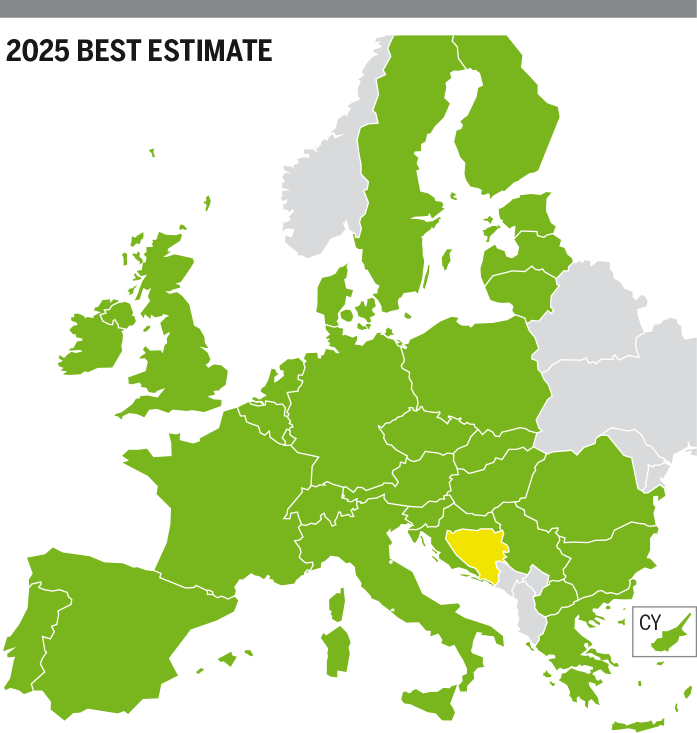


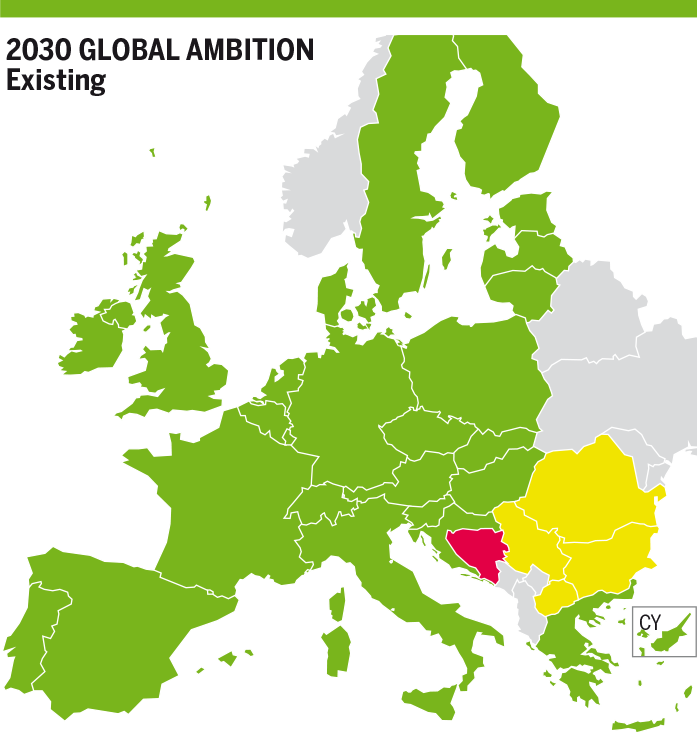
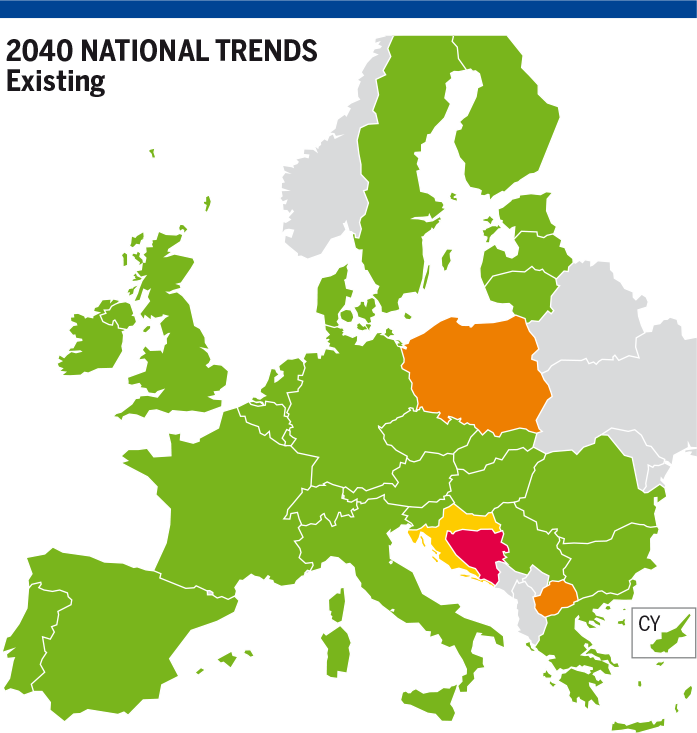
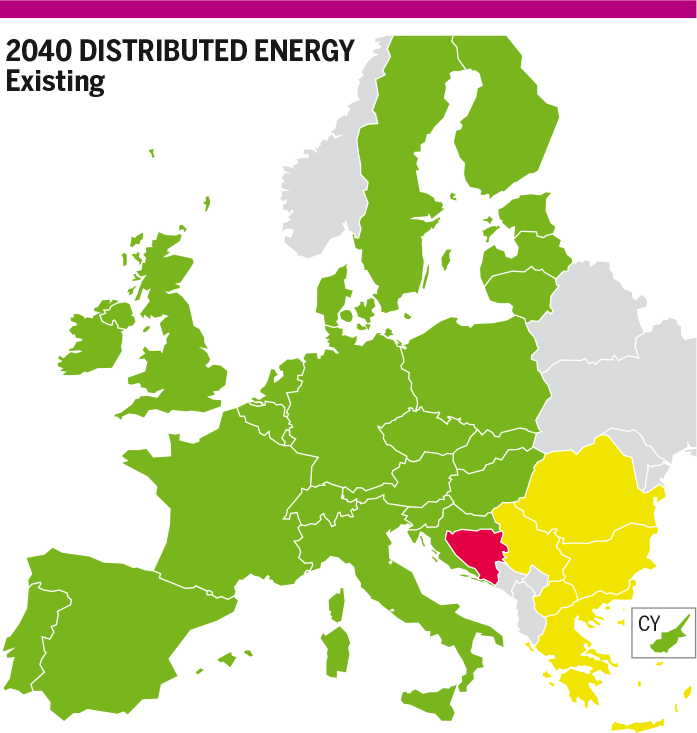
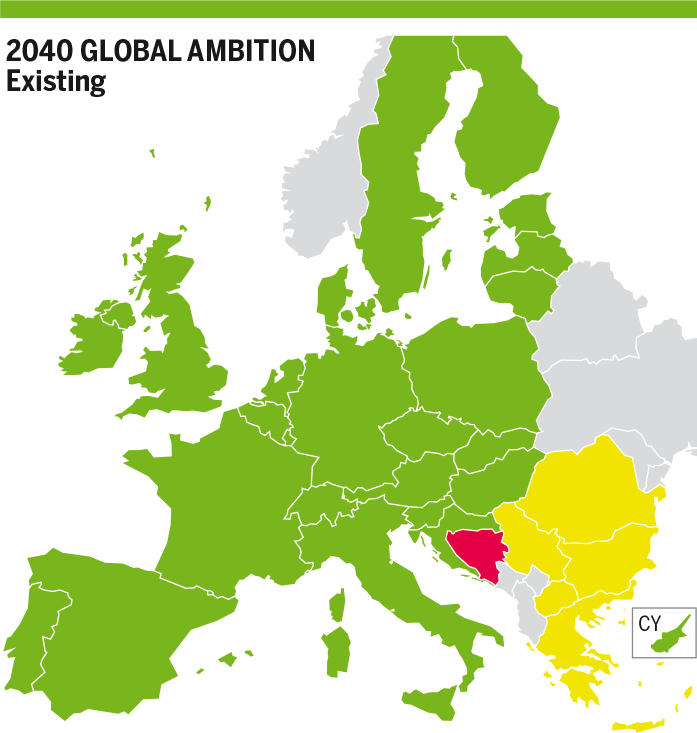


Figure 7.3: Methane Results for 2W Demand in Existing CH₄ Infrastructure and H₂ Level 2


- 2025 – Best Estimate
H₂ Infrastructure Level 1
In Best estimate scenario, all Member States of the European Union satisfy their methane demand due to the available supply and sufficient interconnection capacities, while Bosnia and Herzegovina cannot satisfy its methane demand due to an infrastructure limitation with Serbia.
H₂ Infrastructure Level 2
In Best Estimate scenario, there is no difference within H₂ Infrastructure Level 1 and 2.
- 2030
In all demand scenarios, and both infrastructure levels 1 and 2, Bosnia and Herzegovina shows a methane demand curtailment (54 %).
H₂ Infrastructure Level 1
In National Trends scenario, Poland shows 2 % methane demand curtailment due to infrastructure limitations with neighbouring countries
In Distributed Energy scenario, all countries can satisfy their methane demand.
In Global Ambition scenario, the Eastern countries Bulgaria, Serbia, North Macedonia and Romania show 1 % methane demand curtailment. Infrastructure limitations do not allow neighbouring countries to cooperate more to mitigate methane demand curtailments.
H₂ Infrastructure Level 2
In National Trends and Distributed Energy scenarios, the situation is the same as for the H₂ Infrastructure Level 1.
In Global Ambition scenario, Bulgaria, Serbia, North Macedonia and Romania show 2 % methane demand curtailment. Additional hydrogen production using methane and infrastructure limitations with neighbouring countries increase the methane demand curtailment of 1 % in H₂ Infrastructure Level 1.
- 2040
In all demand scenarios and both H₂ infrastructure levels, Bosnia and Herzegovina shows a methane demand curtailment (64 %).
H₂ Infrastructure Level 1
In the National Trends scenario, Poland (21 %), Croatia (14 %) and North Macedonia (21 %) show methane demand curtailment due to infrastructure limitations with neighbouring countries.
In Distributed Energy scenario, Bulgaria, Greece, Serbia, North Macedonia, and Romania show 2 % methane demand curtailment. Hydrogen production using methane create methane demand curtailment in these countries and infrastructure limitations do not neighbouring countries to cooperate more to mitigate the methane demand curtailment.
In Global Ambition scenario, Bulgaria, Greece, Serbia, North Macedonia, and Romania show 2 % methane demand curtailment. Hydrogen production using methane creates demand curtailment in these countries and infrastructure limitations do not allow neighbouring countries to cooperate more and to mitigate demand curtailment.
H₂ Infrastructure Level 2
In National Trends scenario, Poland increases its methane demand curtailment by +1 % compared with H₂ Infrastructure Level 1 to 22 % due to additional hydrogen production using methane. The situation remains unchanged for Croatia and North Macedonia. Lithuania shows 2 % methane demand curtailment due to infrastructure limitations with Latvia and additional hydrogen production using methane. Luxembourg shows 21 % methane demand curtailment due to hydrogen production using methane that triggers infrastructure limitations with neighbouring countries Belgium and Germany.
In Distributed Energy scenario, Bulgaria, Serbia, North Macedonia, and Romania increase their methane demand curtailment to 12 % due to higher hydrogen production using methane and infrastructure limitations with neighbouring countries. Greece shows only 2 % of methane demand curtailment and cannot cooperate more with Bulgaria due to an infrastructure limitation.
In Global Ambition scenario, Bulgaria, Greece, Serbia, North Macedonia, and Romania increase their methane demand curtailment to 16 % due to higher hydrogen production using methane and infrastructure limitations with neighbouring countries.
- 2050
In all demand scenarios, and both H₂ infrastructure levels, Bosnia and Herzegovina shows methane demand curtailment (64 %).
H₂ Infrastructure Level 1
In Distributed Energy and the Global Ambition scenarios, all countries can satisfy their methane demand.
H₂ Infrastructure Level 2
In Distributed Energy scenario, the situation is the same as observed for H₂ Infrastructure Level 1. Thus, all countries can satisfy their methane demand.
In Global Ambition scenario, Bulgaria, Greece, Serbia, North Macedonia, and Romania increase their methane demand curtailment to 9 % and Croatia shows 1 % methane demand curtailment due to higher hydrogen production using methane and infrastructure limitations with neighbouring countries.
7.2.1.2 Advanced and PCI Infrastructure levels for methane
In the Advanced Infrastructure level in comparison with the Existing Methane Infrastructure level, the methane demand curtailment is fully mitigated in all countries except in Poland in 2040 in the National Trends scenario in both hydrogen infrastructure levels. Poland decreases its methane demand curtailment to 9 % due to additional LNG send-out capacities in the Advanced Infrastructure level. Bosnia and Herzegovina fully mitigates its methane demand curtailment due to the new interconnection with Croatia and the Trans Adriatic Pipeline.
When comparing the PCI Infrastructure level with the existing methane infrastructure level, the methane demand curtailment is fully mitigated in all countries except for Bosnia and Herzegovina as well as Poland. In Bosnia and Herzegovina, the situation remains unchanged. Poland faces methane demand curtailment in 2040 in the National Trends scenario in both hydrogen infrastructure levels. This methane demand curtailment is reduced to 9 % due to additional LNG send-out capacities in the PCI Infrastructure level.
7.2.2 Hydrogen Results
7.2.2.1 Existing Methane Infrastructure
Figure 7.4: Hydrogen Results for 2W Demand in Existing CH₄ Infrastructure and H₂ Level 1
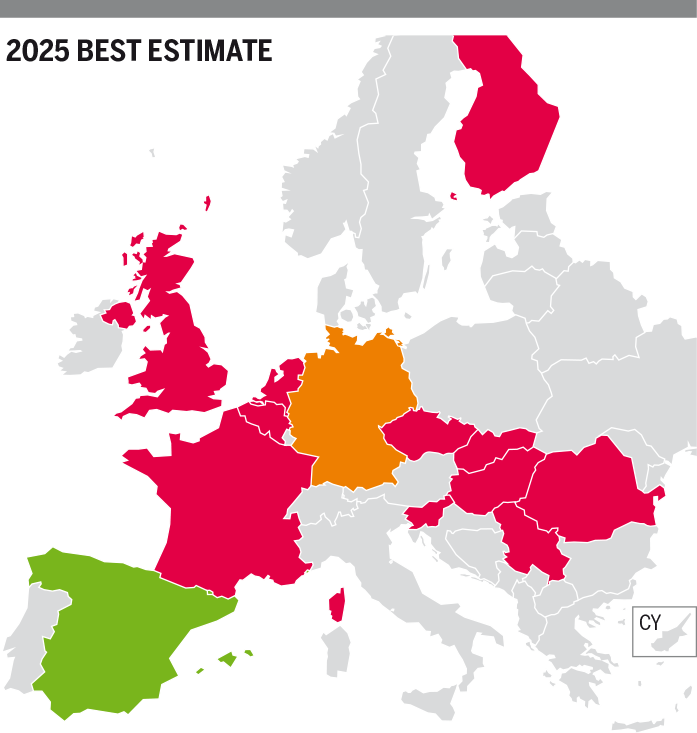
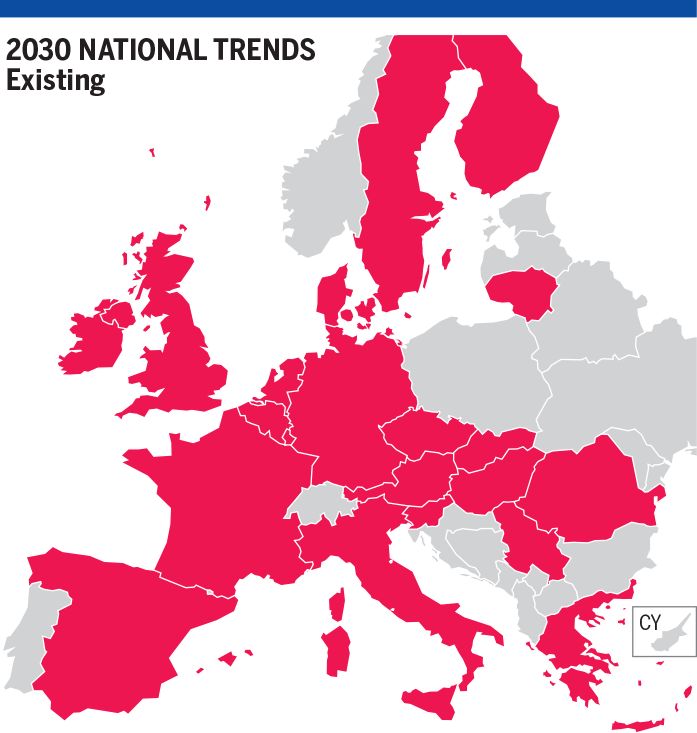
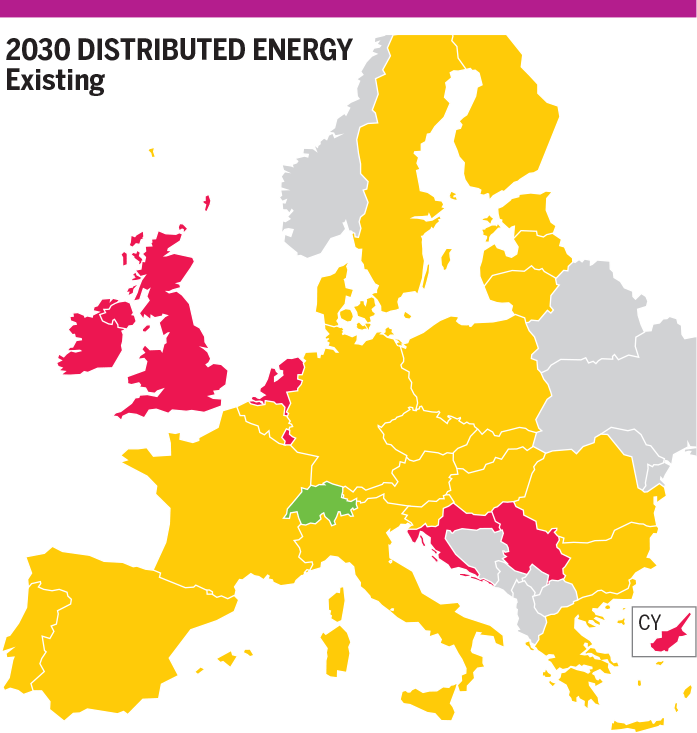
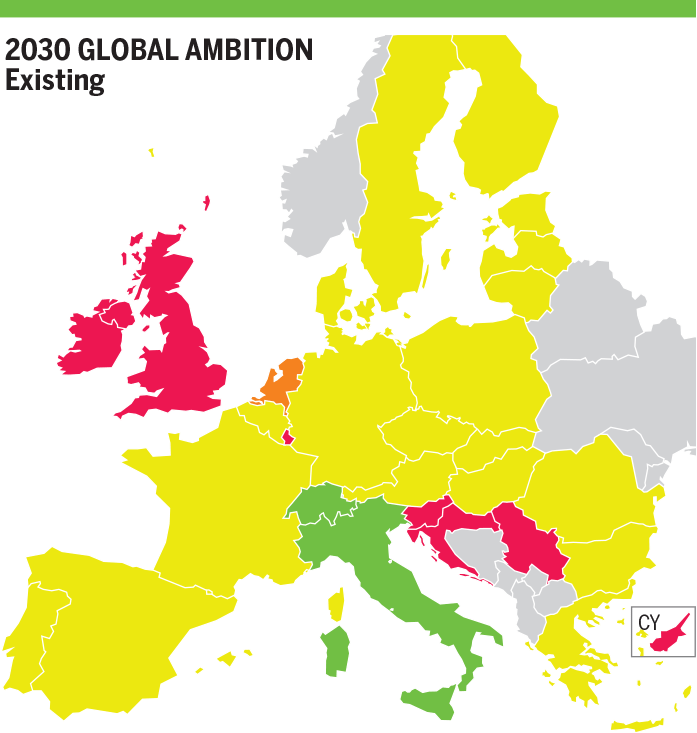
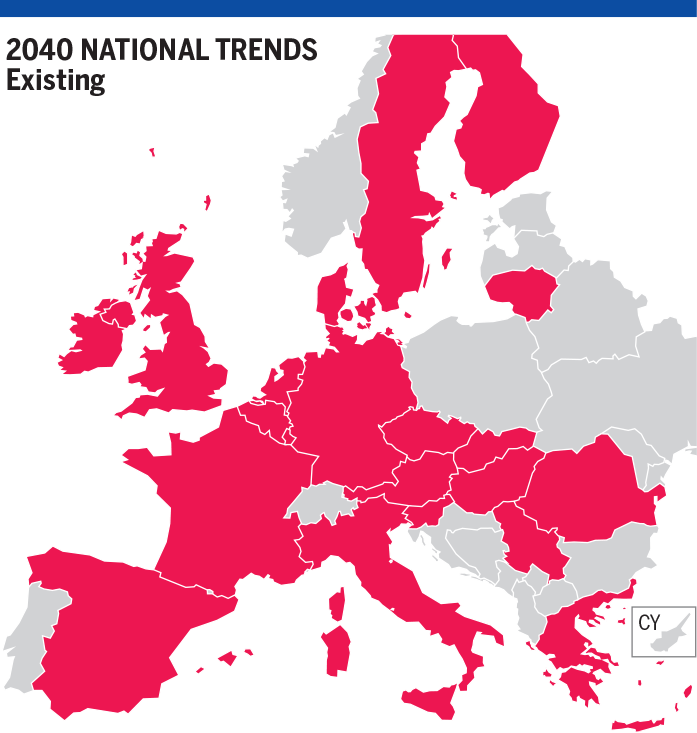
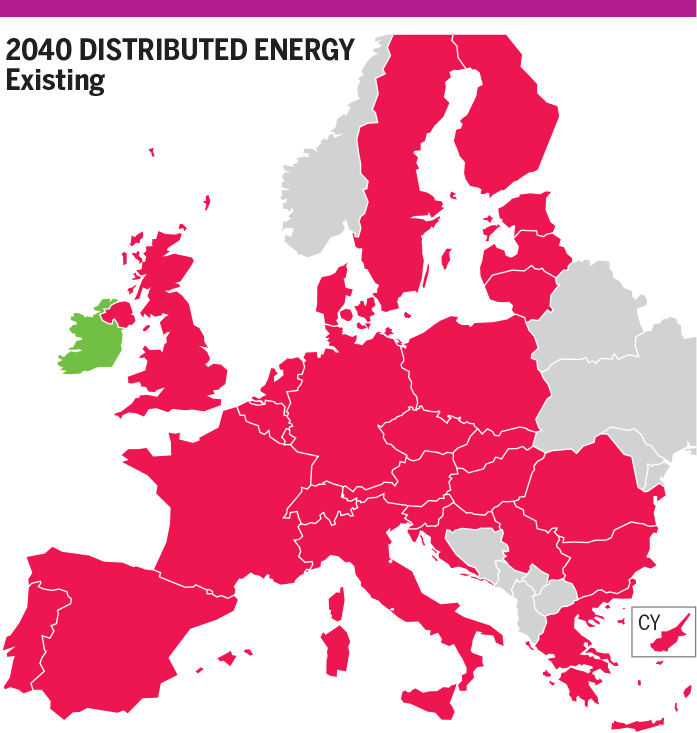

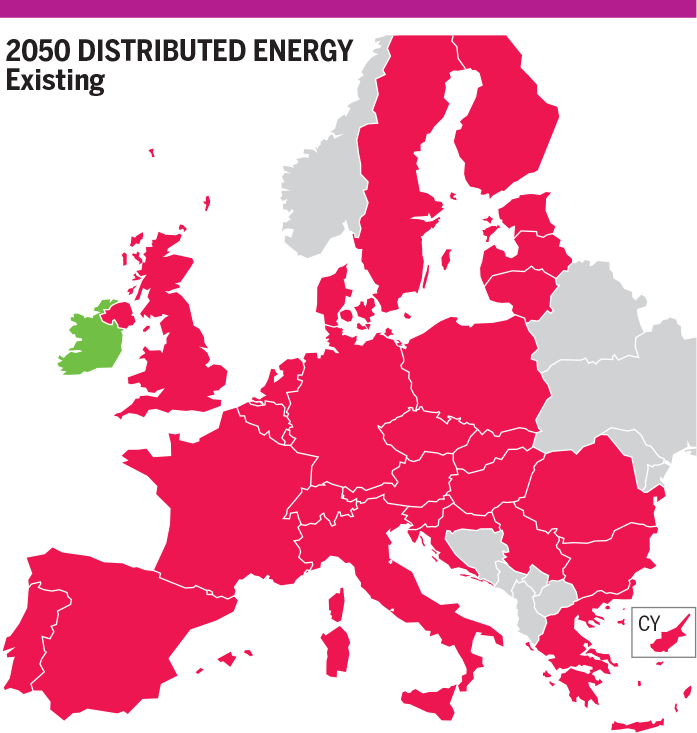
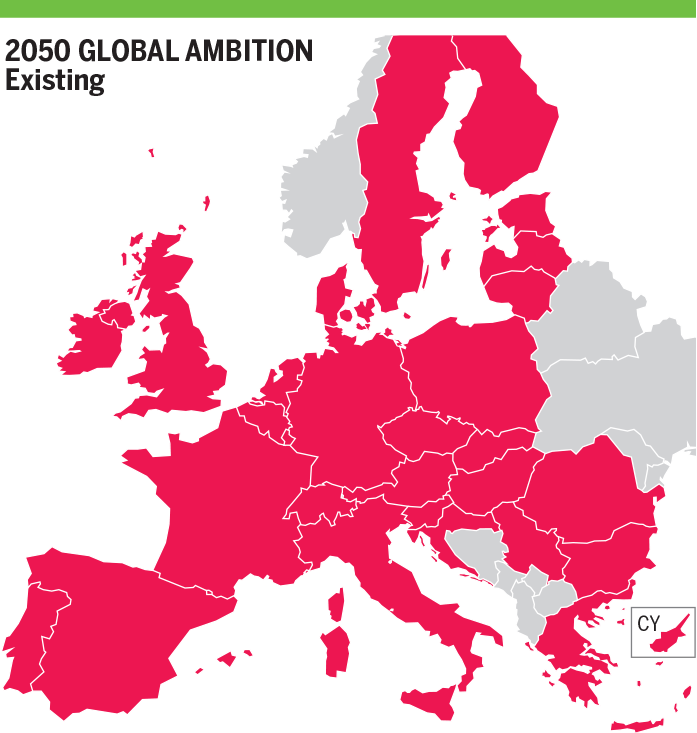

Figure 7.5: Hydrogen Results for 2W Demand in Existing CH₄ Infrastructure and H₂ Level 2


- 2025 – Best Estimate
H₂ Infrastructure Level 1
All countries with demand except for Spain show demand curtailment of 22 % to 100 %. Their national production cannot satisfy their demand. Spain satisfies its demand with its own production.
H₂ Infrastructure Level 2
Additional hydrogen produced using methane, taking advantage of the methane infrastructure flexibility, mitigates the hydrogen demand curtailment. While it can be fully mitigated in Germany and the United Kingdom, the other countries mitigate partially their hydrogen demand curtailment.
- 2030
H₂ Infrastructure Level 1
In National Trends scenario, all countries with hydrogen demand face a hydrogen demand curtailment. Without any imports and hydrogen production using methane infrastructure, most countries show 72 % hydrogen demand curtailment. Greece shows 57 % hydrogen demand curtailment and cannot cooperate with other countries due to infrastructure limitations. The Netherlands shows 77 % hydrogen demand curtailment and Belgium and Germany cannot cooperate more due to infrastructure limitations. Some countries are not interconnected and can only partially satisfy their demand with their own production, leading to the following hydrogen demand curtailments: Slovenia (65 %), United Kingdom (87 %), Ireland (97 %), Luxembourg (97 %) and Serbia (100 %).
In Distributed Energy scenario, all countries show a hydrogen demand curtailment. Most countries show 11 % hydrogen demand curtailment. The Eastern countries Greece, Bulgaria, Romania and Hungary show 17 % hydrogen demand curtailment and countries in the North and West cannot cooperate with them due to infrastructure limitations. The Netherlands shows 31 % hydrogen demand curtailment and Belgium and Germany cannot cooperate more due to infrastructure limitations. Croatia (38 %), Slovenia (89 %), Serbia (100 %), Luxembourg (70 %), United Kingdom (71 %) and Ireland (43 %) are not interconnected with other countries and cannot fully satisfy their hydrogen demand with their own national production.
In Global Ambition scenario, most of the countries show 2 % hydrogen demand curtailment. Italy shows no hydrogen demand curtailment due to the North African supply, ., but it cannot cooperate more as the infrastructure with Austria is fully used. Infrastructure limitations restrict Italy’s cooperation with the connected country Austria.
H₂ Infrastructure Level 2
In National Trends scenario, due to new interconnections and additional hydrogen production using methane, demand curtailment is fully mitigated in all countries in comparison with the H₂ Infrastructure Level 1. Luxembourg (37 %) and Serbia (47 %) show hydrogen demand curtailments due to missing interconnections and limited access to hydrogen production using methane.
In Distributed Energy scenario, due to new interconnections and additional hydrogen production using methane, most of the countries mitigate their demand curtailment to 3 % in comparison with the H₂ Infrastructure Level 1. Ireland fully mitigates its hydrogen demand curtailment. The Eastern countries Greece, Bulgaria, Romania and Hungary mitigate their hydrogen demand curtailment to 9 %. The United Kingdom (19 %), Luxembourg (15 %), Slovenia (29 %), Croatia (41 %) and Serbia (41 %) partially mitigate their hydrogen demand curtailment.
In Global Ambition scenario, most countries fully mitigate their hydrogen demand curtailment. Romania, Greece, Bulgaria and Hungary mitigate their demand hydrogen curtailment to 1 %. The United Kingdom (27 %), Luxembourg (17 %), Slovenia (32 %), Croatia (40 %) and Serbia (41 %) partially mitigate their hydrogen demand curtailment.
- 2040
H₂ Infrastructure Level 1
In National Trends scenario, all countries with hydrogen demand show demand curtailment. Without any supply and hydrogen production using methane infrastructure, most countries show 57 % of hydrogen demand curtailment. The Netherlands shows 89 % hydrogen demand curtailment and Belgium and Germany cannot cooperate more due to infrastructure limitations. Countries that are not interconnected show higher demand curtailments: Ireland (85 %), United Kingdom (95 %), Luxembourg (97 %) and Serbia (100 %).
In Distributed Energy scenario, all countries show a hydrogen demand curtailment. Most countries show 34 % hydrogen demand curtailment. Countries not interconnected show higher demand curtailments: Serbia (100 %), Luxembourg (87 %) and United Kingdom (83 %). Ireland satisfies its hydrogen demand due to sufficient national hydrogen production.
In Global Ambition scenario, all countries show a hydrogen demand curtailment. Most countries show 50 % hydrogen demand curtailment. Countries not interconnected show higher demand curtailments: Serbia (100 %), Luxembourg (91 %), Ireland (65 %) and United Kingdom (85 %).
H₂ Infrastructure Level 2
In National Trends scenario, due to new interconnections and additional hydrogen production using methane, most of the countries mitigate their hydrogen demand curtailment to 1 % in comparison with the H₂ Infrastructure Level 1. Only Luxembourg shows 21 % hydrogen demand curtailment due to missing interconnections and limited access to hydrogen production using methane.
In the Distributed Energy scenario, most of the countries mitigate their hydrogen demand curtailment to 19 % in comparison with the H₂ Infrastructure Level 1. The Eastern countries Serbia, Croatia, Romania, Hungary and Slovakia show 16 % hydrogen demand curtailment and cannot cooperate with other countries due to infrastructure limitations. Greece and Bulgaria show 28 % hydrogen demand curtailment and Romania cannot cooperate more with Bulgaria due to an infrastructure limitation. Ireland is the only country that can fully mitigate its demand curtailment. The United Kingdom shows 32 % hydrogen demand curtailment.
In Global Ambition scenario, all countries mitigate their hydrogen demand curtailment in comparison with the H₂ Infrastructure Level 1. Most of the countries mitigate their hydrogen demand curtailment to 32 %. Ireland mitigates its hydrogen demand curtailment to 22 % and the United Kingdom to 35 %.
- 2050
H₂ Infrastructure Level 1
In Distributed Energy scenario, most countries show 43 % hydrogen demand curtailment. The Eastern countries Greece, Bulgaria, Slovakia, Hungary, Croatia and Romania show 32 % hydrogen demand curtailment and cannot cooperate more with interconnected countries in the North due to infrastructure limitations. Ireland can satisfy its demand with its own production and countries not interconnected show higher demand curtailments: Serbia (100 %), Luxembourg (90 %) and United Kingdom (57 %).
In the Global Ambition scenario, all countries show hydrogen demand curtailment. Most countries show 59 % hydrogen demand curtailment. Ireland shows 51 % hydrogen demand curtailment and cannot satisfy its demand with its own production. Greece shows 65 % hydrogen demand curtailment, and a bottleneck does not allow Bulgaria to cooperate more to mitigate further the demand curtailment in Greece. Some countries not interconnected show higher demand curtailments: Serbia (100 %), Luxembourg (94 %) and United Kingdom (68 %).
H₂ Infrastructure Level 2
In Distributed Energy scenario, due to new interconnections and additional hydrogen production using methane, Ireland fully mitigates its hydrogen demand curtailment and the other countries mitigate their hydrogen demand curtailment to 18 % in comparison with the H₂ Infrastructure Level 1. The Eastern countries Greece, Bulgaria, Serbia, Slovakia, Croatia, Romania and Hungary mitigate their hydrogen demand curtailment to 15 %. The United Kingdom mitigates its hydrogen demand curtailment to 27 % and Belgium and Ireland cannot cooperate more with United Kingdom due to infrastructure limitations.
In Global Ambition scenario, due to new interconnections and additional hydrogen production using methane, all countries mitigate their demand curtailment in comparison with the H₂ Infrastructure Level 1. Most countries show 21 % of hydrogen demand curtailment. Greece, Bulgaria, and Romania mitigate their hydrogen demand curtailment to 25 %.
7.2.2.2 Advanced and PCI Infrastructure levels for methane
The Advanced and PCI Infrastructure levels for methane do not show any different hydrogen curtailment rates in comparison with the Existing Methane Infrastructure level.
The hydrogen infrastructure is limited to how much methane can be used to produce hydrogen and the Advanced and PCI Infrastructure levels do not add any additional hydrogen production possibilities.
7.3 2-Week Dunkelflaute demand
The 2-Week Dunkelflaute country demands are generally very similar to the 2-Week Cold Spell demand values. Hydrogen demand is the same for Best Estimate and National Trends scenarios and it is also the same in the year 2030 of Distributed Energy and Global Ambition scenarios. Regarding Distributed Energy and Global Ambition scenarios in 2040 and 2050, only Italy, The Netherlands, Romania and United Kingdom show higher values in 2-Week Dunkelflaute.
Regarding the methane demand values, only Bulgaria, Czech Republic, Germany, Croatia and Italy present slight differences when comparing demand of 2-Week Dunkelflaute with 2-Week Cold in Best Estimate and National trends scenarios.
In Distributed Energy and Global Ambition scenarios just Spain, France, Greece, Italy, The Netherlands, Portugal, Romania and United Kingdom present higher methane demand in 2-Week Dunkelflaute.
Consequently, the curtailment rate results in 2-Week Dunkelflaute and in 2-Week Cold Spell are exactly the same for most of the countries. The countries with higher demand in 2-Week Dunkelflaute are only increasing their demand curtailment rate in 1 or 2 % maximum.
7.4 Peak demand
7.4.1 Methane Results
7.4.1.1 Existing Methane Infrastructure
Figure 7.6: Methane Results for Peak Demand in Existing CH₄ Infrastructure and H₂ Level 1
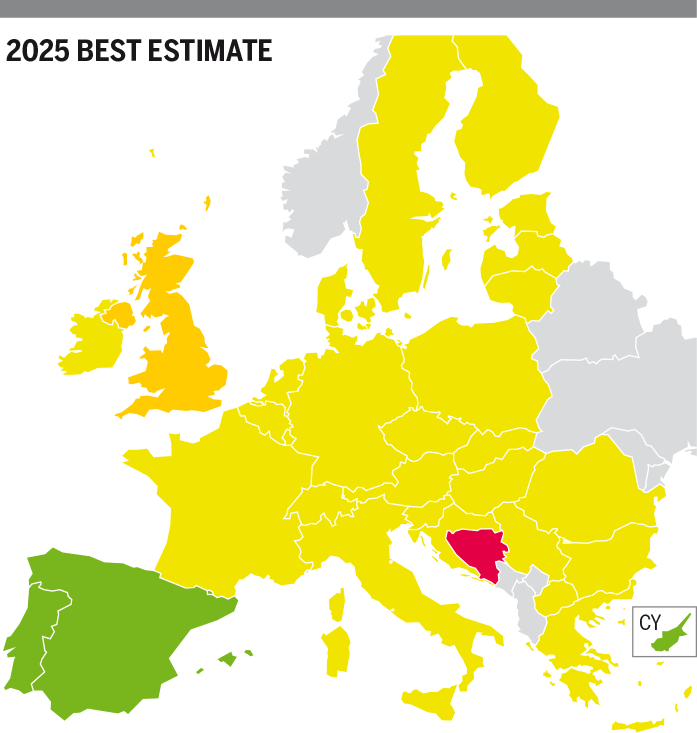


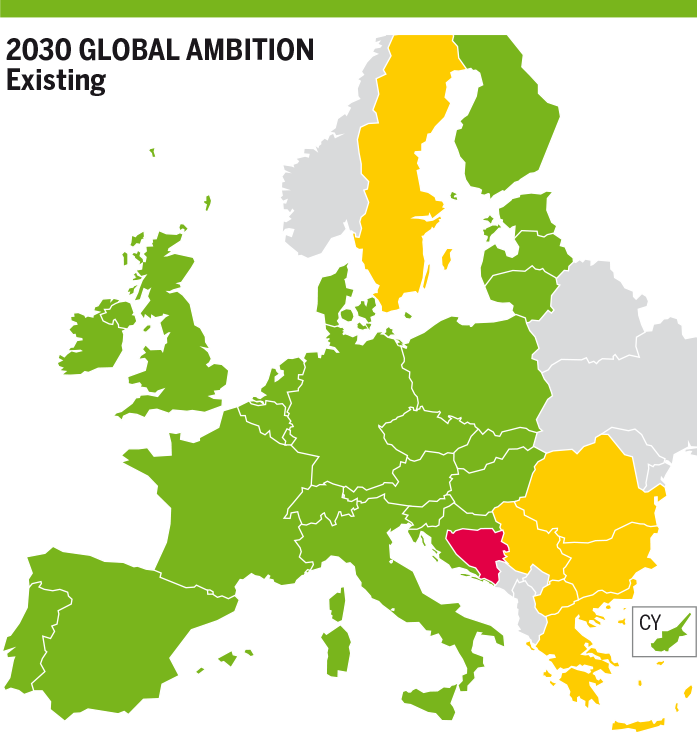
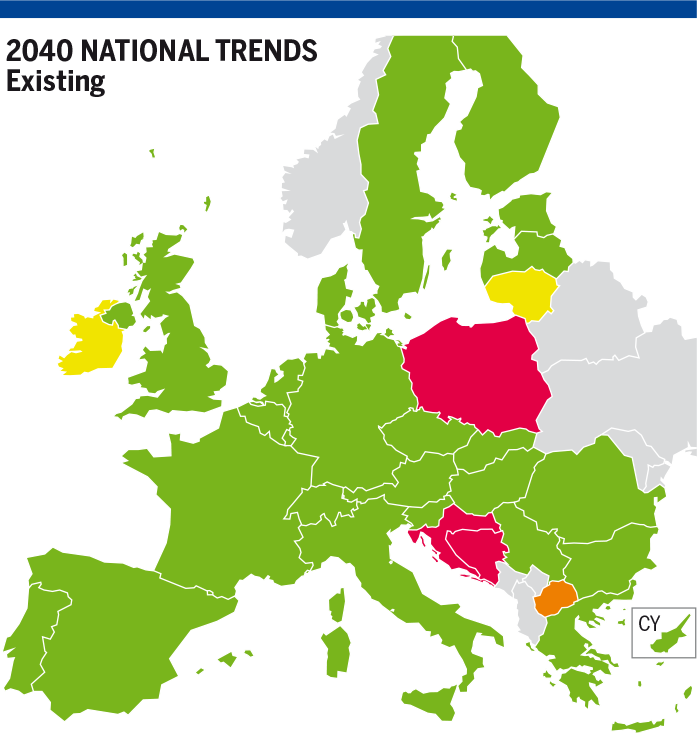
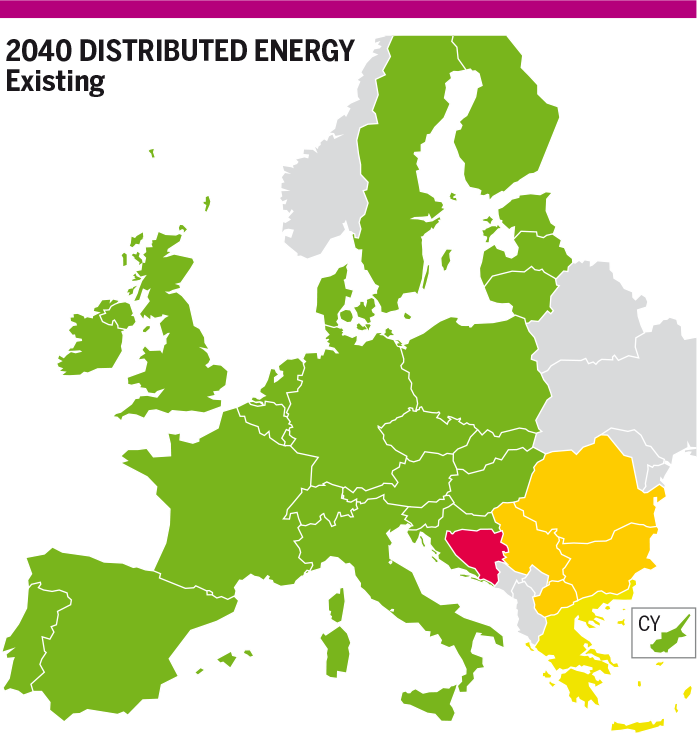
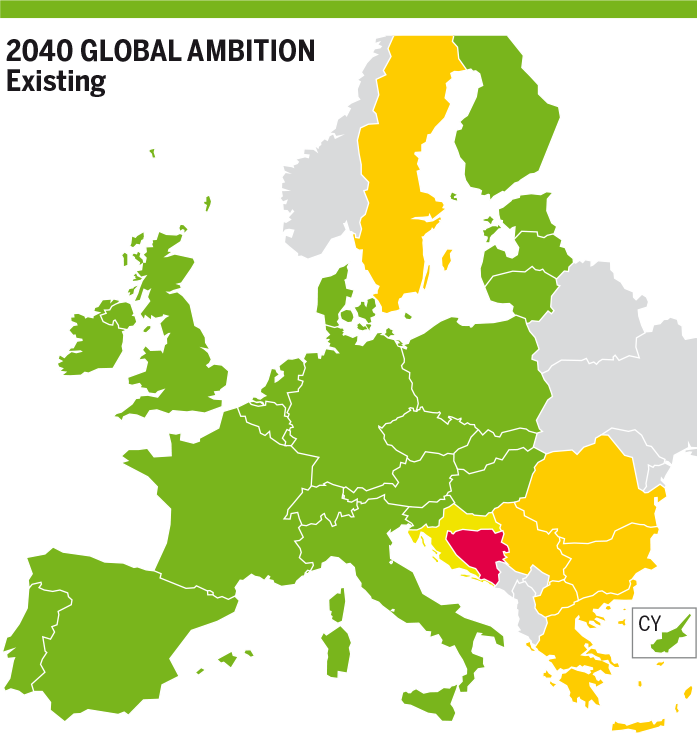

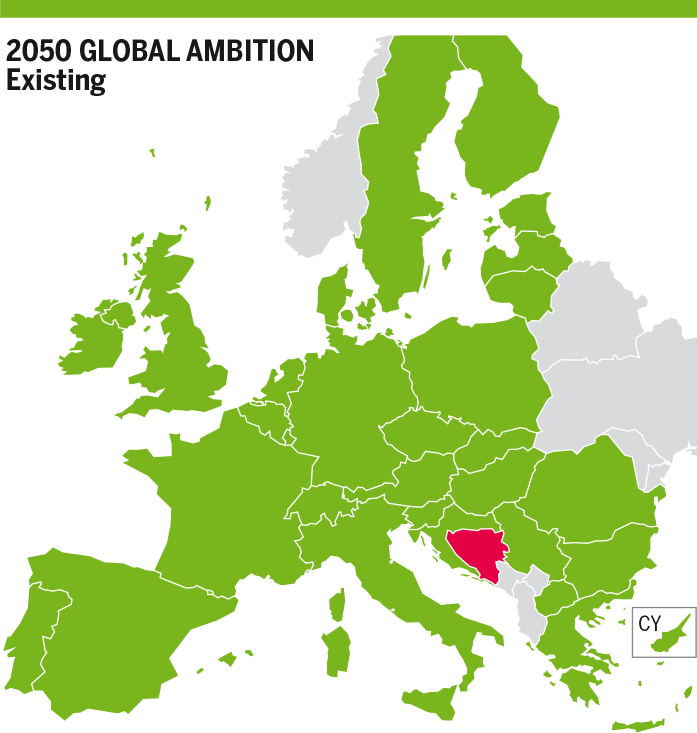

Figure 7.7: Methane Results for Peak Demand in Existing CH₄ Infrastructure and H₂ Level 2


- 2025 – Best Estimate
H₂ Infrastructure Level 1
Most countries show 8 % to 9 % methane demand curtailment. Supply cannot satisfy demand and infrastructure allows countries to cooperate to mitigate demand curtailment in a cooperative manner. The United Kingdom (10 %), Ireland (9 %) and Bosnia and Herzegovina (61 %) show more methane demand curtailment due to infrastructure limitations with neighbouring countries. Spain and Portugal do not show any demand curtailment due to supply flexibility (LNG). They cannot cooperate more with France due to infrastructure limitations.
H₂ Infrastructure Level 2
Methane demand curtailment increases by 1 % to 2 %, while its stable in Bosnia and Herzegovina, due to hydrogen production using methane.
- 2030
In both H₂ infrastructure levels and all scenarios, Bosnia and Herzegovina shows 79 % methane demand curtailment due to an infrastructure limitation with Serbia.
H₂ Infrastructure Level 1
In National Trends scenario, most of the countries show a methane demand curtailment. Infrastructure limitations do not allow them to fully cooperate to mitigate the methane demand curtailment to reach the same level across Europe. Spain and Portugal do not show any methane demand curtailment due to their supply flexibility (LNG). Most of the countries show 3 % to 4 % methane demand curtailment. United Kingdom, Belgium and The Netherlands show 6 % methane demand curtailment and France cannot cooperate more due to infrastructure limitations to mitigate demand curtailment in Belgium. Ireland shows 13 % methane demand curtailment and the United Kingdom cannot cooperate more with Ireland to mitigate demand curtailment due to infrastructure limitations. Germany and Poland show respectively 10 % and 14 % methane demand curtailment and countries interconnected cannot cooperate more with them to mitigate their demand curtailment due to infrastructure limitations.
In Distributed Energy scenario, most countries can satisfy their demand. Only the Eastern countries Romania, Serbia, Bulgaria, North Macedonia and Greece show 7 % methane demand curtailment. Infrastructure limitations do not allow other countries to increase their cooperation to mitigate the methane demand curtailment in the mentioned countries.
In Global Ambition scenario, most countries can satisfy their demand. The Eastern countries Romania, Serbia, Bulgaria, North Macedonia and Greece show 17 % methane demand curtailment. Infrastructure limitations do not allow other countries to increase their cooperation to mitigate the methane demand curtailment in the mentioned countries. Sweden shows 17 % methane demand curtailment due to a very high estimation of the methane peak demand and an infrastructure limitation with Denmark.
H₂ Infrastructure Level 2
In National Trends scenario, most countries with low demand curtailments show additional demand curtailment of 1 % due to additional hydrogen production using methane in comparison with the H₂ Infrastructure Level 1.
In the Distributed Energy scenario, countries in the East increase their methane demand curtailment to 9 % to 10 % due to additional hydrogen production using methane in comparison with the H₂ Infrastructure Level 1.
In Global Ambition scenario, Eastern curtailed countries in H₂ Infrastructure Level 1 show additional methane demand curtailment of 1 % due to additional hydrogen production using methane. Poland, Denmark, Czech Republic, Slovakia, Lithuania, Latvia, Estonia and Finland show methane demand curtailments of 1 % to 2 %. Sweden decreases its methane demand curtailment to 10 % due to a new hydrogen interconnection from Finland which leads to a decreased production of hydrogen using methane.
- 2040
In both H₂ infrastructure levels and all scenarios, Bosnia and Herzegovina shows 84 % methane demand curtailment due to an infrastructure limitation with Serbia.
H₂ Infrastructure Level 1
In National Trends scenario, several countries show a methane demand curtailment. Ireland (6 %), Croatia (30 %), and North Macedonia (21 %) show methane demand curtailment due to infrastructure limitations with neighbouring countries. In Poland, infrastructure limitations from neighbouring countries limit cooperation. Poland shows 31 % methane demand curtailment. Lithuania shows 5 % methane demand curtailment due to an infrastructure limitation with Latvia.
In Distributed Energy scenario, most countries can satisfy their demand. The Eastern countries Romania, Serbia, Bulgaria, and North Macedonia show 11 % demand curtailment. Infrastructure limitations do not allow other countries to increase their cooperation to mitigate their methane demand curtailment. Greece shows 9 % methane demand curtailment and cannot cooperate more with Bulgaria due to an infrastructure limitation.
In Global Ambition scenario, most of the countries can satisfy their demand. The Eastern countries Romania, Serbia, Bulgaria, North Macedonia and Greece shows 12 % methane demand curtailment. Infrastructure limitations do not allow other countries to increase their cooperation to mitigate their methane demand curtailment. Croatia shows 8 % methane demand curtailment and infrastructure limitations do not allow interconnected countries to cooperate more with Croatia to mitigate its demand curtailment. Sweden shows 11 % curtailment rate due to a very high projection of the methane peak demand and a bottleneck with Denmark.
H₂ Infrastructure Level 2
All changes described in this section are in comparison with the H₂ Infrastructure Level 1.
In National Trends scenario, with additional hydrogen production using methane and repurposed infrastructures, most of the countries show 5 % to 6 % methane demand curtailment. Luxembourg shows 36 % methane demand curtailment due to hydrogen production using methane that triggers infrastructure limitations with neighbouring countries Belgium and Germany. The United Kingdom and Ireland show 10 % methane demand curtailment and Belgium and The Netherlands cannot cooperate more to mitigate the methane demand curtailment due to infrastructure limitations with the United Kingdom.
In Distributed Energy scenario, the Eastern countries Romania, Serbia, Bulgaria and North Macedonia increase their methane demand curtailment to 24 % due to additional hydrogen production using methane.
In Global Ambition scenario, the Eastern countries Romania, Serbia, Bulgaria and North Macedonia increase their methane demand curtailment to 27 % due to additional hydrogen production using methane.
- 2050
H₂ Infrastructure Level 1
In Distributed Energy and Global Ambition scenarios, all countries can satisfy their demand except for Bosnia and Herzegovina with 84 % methane demand curtailment due to an infrastructure bottleneck with Serbia.
H₂ Infrastructure Level 2
In Distributed Energy scenario, all countries can satisfy their demand.
In Global Ambition scenario, the Eastern countries Romania, Serbia, Bulgaria and Greece show 18 % demand curtailment and Croatia shows 13 % due to infrastructure limitations with countries in the West and additional hydrogen production using methane.
7.4.1.2 Advanced Methane Infrastructure
The Advanced Infrastructure level for methane improves the situation in all scenarios and years and for all countries.
- 2025 – Best Estimate
H₂ Infrastructure Level 1
In Best Estimate scenario, most countries fully mitigate their methane demand curtailment. Ireland and the United Kingdom mitigate their methane demand curtailment to 5 %.
H₂ Infrastructure Level 2
In Best Estimate scenario, most countries show 1 % methane demand curtailment due to additional hydrogen production using methane.
- 2030
H₂ Infrastructure Level 1
In National Trends scenario, all countries fully mitigate their demand curtailment except for Ireland. The situation remains unchanged for Ireland in comparison with the Existing Methane Infrastructure level due to an infrastructure limitation with the United Kingdom.
In Distributed Energy scenario, all countries fully mitigate their methane demand curtailment.
In Global Ambition scenario, all countries fully mitigate demand curtailment except for Sweden where the situation remains unchanged compared to the Existing Methane Infrastructure.
H₂ Infrastructure Level 2
In National Trends scenario, the methane results remains unchanged in comparison with the H₂ Infrastructure Level 1.
In Distributed Energy scenario, the methane results remains unchanged in comparison with the H₂ Infrastructure Level 1.
In Global Ambition scenario, Sweden mitigates its methane demand curtailment to 10 % due to a new hydrogen interconnection with Finland which allows Sweden to decrease its hydrogen production using methane.
- 2040
H₂ Infrastructure Level 1
In National Trends scenario, all countries fully mitigate their methane demand curtailment except Ireland (6 %) and Poland (19 %) only partially mitigating their demand curtailment.
In Distributed Energy scenario, all countries fully mitigate their methane demand curtailment.
In Global Ambition scenario, all countries fully mitigate their methane demand curtailment except Sweden. Sweden shows 11 % methane demand curtailment as for the Existing Methane Infrastructure level due to a very high methane peak demand.
H₂ Infrastructure Level 2
In National Trends scenario, due to additional hydrogen production using methane, Ireland and the United Kingdom increase their methane demand curtailment to 10 %. Poland also increases its methane demand curtailment to 20 %, i. e., 1 % more than for the H₂ Infrastructure Level 1. Luxembourg shows 36 % methane demand curtailment due to hydrogen production using methane that triggers infrastructure limitations with neighbouring countries Belgium and Germany as for the Existing Methane Infrastructure level.
In Distributed Energy scenario, there is no methane demand curtailment as for the H₂ Infrastructure Level 1.
In Global Ambition scenario, the Eastern countries Romania, Serbia, Bulgaria and Greece increase their methane demand curtailment to 27 % due to additional hydrogen production using methane and limited connections with the West.
- 2050
In both H₂ Infrastructure levels, in all scenarios, methane demand curtailment is fully mitigated in 2050.
7.4.1.3 PCI Methane Infrastructure level
The situation remains unchanged for Bosnia and Herzegovina in all scenarios and years compared to the Existing Methane Infrastructure level.
- 2025 – Best Estimate
H₂ Infrastructure Level 1
In Best Estimate scenario, the methane demand curtailment is mitigated to 7 % in all curtailed countries in the Existing Methane Infrastructure level.
H₂ Infrastructure Level 2
In Best Estimate scenario, the situation remains unchanged in comparison with the Existing Methane Infrastructure level.
- 2030
H₂ Infrastructure Level 1
In National Trends scenario, several countries fully mitigate or partially mitigate their methane demand curtailment. Belgium, The Netherlands, Sweden, Denmark and Switzerland mitigate their methane demand curtailment to 1 %. Germany mitigates its methane demand curtailment to 4 % and Czech Republic and Poland mitigate their methane demand curtailment to 6 % and 7 % respectively. The United Kingdom mitigates its methane demand curtailment to 2 %.
In Distributed Energy scenario, the methane demand curtailment is fully mitigated.
In Global Ambition scenario, the methane demand curtailment is fully mitigated except in Serbia and North Macedonia that show 1 % methane demand curtailment. For Sweden the situation remains unchangedi n comparison with existing.
H₂ Infrastructure Level 2
In National Trends scenario, the methane demand curtailment is similar to the one for the Existing Methane Infrastructure level with 2 % to 7 % methane demand curtailment due to hydrogen production using methane.
In the Distributed Energy scenario, the situation is unchanged.
In the Global Ambition scenario, countries showing methane demand curtailment increase their methane demand curtailment by 1 % due to hydrogen production using methane.
- 2040
H₂ Infrastructure Level 1
In National Trends scenario, Ireland and North Macedonia do not improve their methane demand curtailment. Poland, Lithuania and Croatia mitigate their methane curtailment rate to respectively 21 %, 0 % and 13 %. Slovenia cooperates with Croatia and shows 13 % methane curtailment rate.
In Distributed Energy scenario, demand curtailment is fully mitigated in all countries.
In Global Ambition scenario, most of the countries fully mitigate their methane demand curtailment. Sweden, Serbia and North Macedonia mitigate their methane curtailment rate to 10 %, 1 % and 1 %.
H₂ Infrastructure Level 2
In National Trends scenario, only a part of the countries with curtailed methane demand fully mitigate their methane demand curtailment. Other countries decrease their methane demand curtailment to 1 % due to additional flexibility in the PCI infrastructure level.
In Distributed Energy scenario, there is no change compared to H₂ Infrastructure Level 1.
In Global Ambition scenario, there is no change compared to H₂ Infrastructure Level 1.
- 2050
H₂ Infrastructure Level 1
In Distributed Energy scenario and in Global Ambition scenario, methane demand curtailment is fully mitigated in all countries.
H₂ Infrastructure Level 2
In Distributed Energy scenario and in Global Ambition scenario, there is no change compared to H₂ Infrastructure Level 1, i. e., the methane demand curtailment is fully mitigated in all countries.
7.4.2 Hydrogen results
7.4.2.1 Existing Methane Infrastructure level
Figure 7.8: Hydrogen Results for Peak Demand in Existing CH₄ Infrastructure and H₂ Level 1
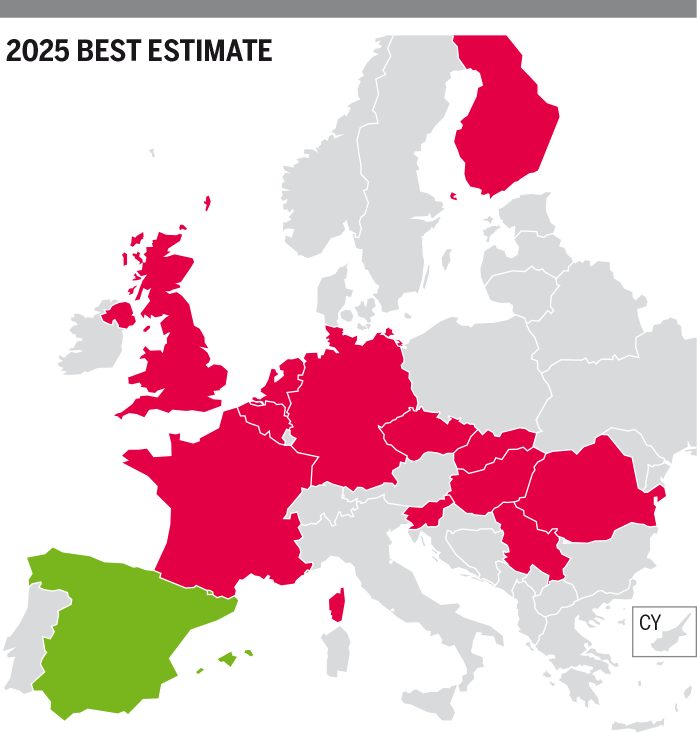
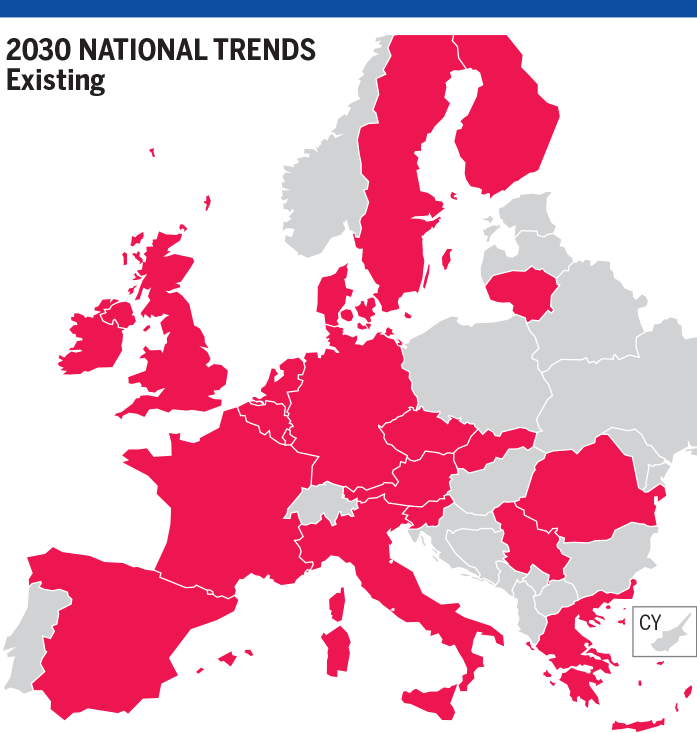
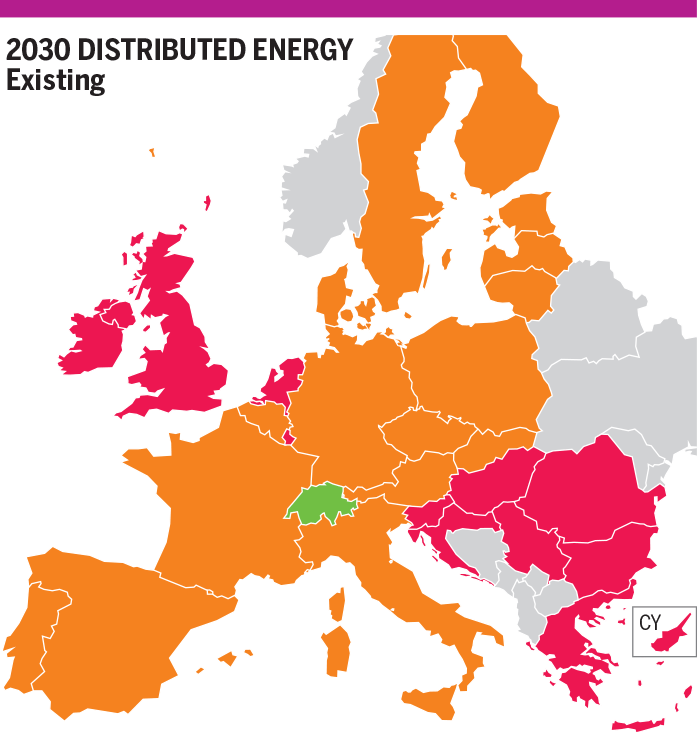
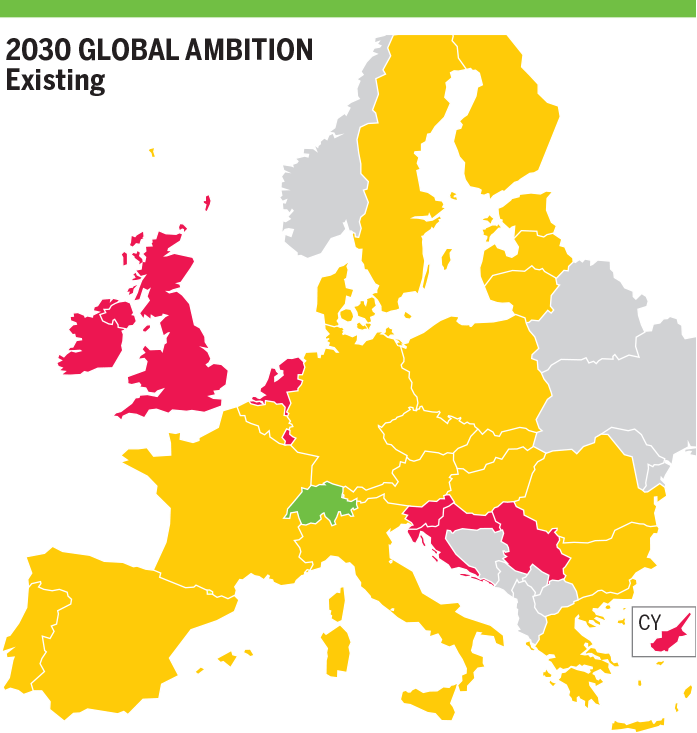


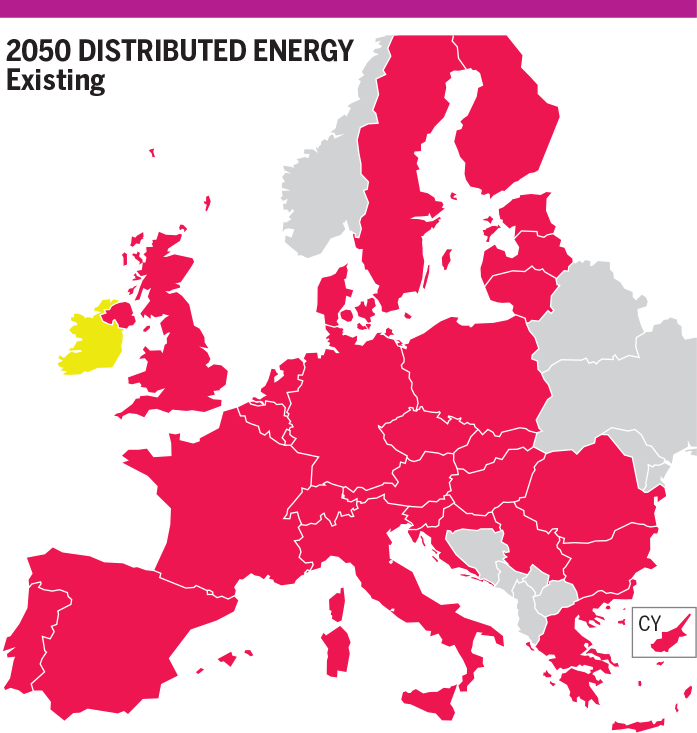


Figure 7.9: Hydrogen Results for Peak Demand in Existing CH₄ Infrastructure and H₂ Level 2


- 2025 – Best Estimate
H₂ Infrastructure Level 1
In Best Estimate scenario, all countries with hydrogen demand are partially curtailed. Without any hydrogen infrastructure, countries must satisfy demand with national production which is not sufficient and cause hydrogen curtailment rates: Germany (33 %), United Kingdom (66 %), Belgium (90 %), Czech Republic (93 %), Hungary (97 %), Slovakia (98 %), Slovenia (98 %) and Serbia, France, Latvia, The Netherlands, Romania and Finland (all 100 %).
H₂ Infrastructure Level 2
In Best Estimate scenario, due to additional hydrogen production using methane, all countries mitigate their demand curtailment to levels between 10 % and 48 %.
- 2030
H₂ Infrastructure Level 1
In National Trends scenario, most countries with hydrogen demand show 61 % of hydrogen curtailment rate. Greece with 49 % hydrogen curtailment rate benefits from more hydrogen production that it cannot share. The Netherlands shows 77 % hydrogen curtailment rate and Belgium and Germany cannot cooperate more to mitigate The Netherlands’ demand curtailment due to infrastructure limitations. Without any interconnections, some countries show higher hydrogen curtailment rates: Slovenia (86 %), United Kingdom (91 %), Ireland (98 %) Luxembourg (97 %) and Serbia (100 %) cannot satisfy their hydrogen demand with their own hydrogen production.
In Distributed Energy scenario, most of the countries show 25 % of hydrogen curtailment rate. The Netherlands (41 %) and Croatia, Hungary, Romania, Bulgaria and Greece (all 31 %) suffer from infrastructure limitations with neighbouring countries. Without any interconnections, some countries show higher hydrogen curtailment rates: Luxembourg (74 %), Slovenia (91 %), Croatia (49 %), Serbia (100 %), United Kingdom (78 %) and Ireland (62 %) cannot satisfy their hydrogen demand with their own hydrogen production.
In Global Ambition scenario, most of the countries show 16 % hydrogen curtailment rate. The Netherlands shows 41 % demand curtailment due to infrastructure limitations with neighbouring countries. Without any interconnections, some countries show higher hydrogen curtailment rates: Croatia (45 %), Luxembourg (71 %), Slovenia (94 %), Serbia (100 %), United Kingdom (76 %) and Ireland (62 %) cannot satisfy their hydrogen demand with their own hydrogen production.
H₂ Infrastructure Level 2
In National Trends scenario, all countries mitigate their demand curtailment compared to H₂ Infrastructure Level 1 due to additional hydrogen production using methane and methane infrastructure flexibility. Most of the countries mitigate their hydrogen curtailment to 5 %. Some countries are not interconnected but can still mitigate their hydrogen curtailment rate: United Kingdom (6 %), Ireland (13 %), Slovenia (19 %), Serbia (47 %) and Luxembourg (49 %).
In Distributed Energy scenario, due to additional interconnections and increased capacities, demand curtailment is mitigated to 14 % for most of the countries compared to H₂ Infrastructure Level 1. The Eastern countries Romania, Bulgaria and Greece mitigate their hydrogen curtailment rate to 24 % due to infrastructure limitations with neighbouring countries. Croatia (49 %), Serbia (49 %), Slovenia (42 %), Luxembourg (27 %), Ireland (25 %) and the United Kingdom (36 %) are not interconnected with neighbouring countries but can mitigate the hydrogen curtailment rate by producing additional hydrogen from available methane.
In Global Ambition scenario, most of the countries mitigate their hydrogen curtailment rate to 7 %. 17 % are observed in Eastern countries and 45 % in Croatia, Serbia and Slovenia. Ireland (20 %) and United Kingdom (40 %) mitigate their hydrogen curtailment rate. Due to additional hydrogen production using methane, countries not interconnected can mitigate their hydrogen curtailment rate.
- 2040
H₂ Infrastructure Level 1
In National Trends scenario, results are similar to 2030. Most of the countries show 53 % hydrogen curtailment rate. The Netherlands shows 89 % hydrogen curtailment rate and Belgium and Germany cannot cooperate more with The Netherlands due to infrastructure limitations. Ireland (93 %), the United Kingdom (97 %), Luxembourg (97 %) and Serbia (100 %) are not interconnected with other countries and cannot satisfy their hydrogen demand with their own hydrogen production.
In Distributed Energy scenario, most of the countries show 43 % hydrogen curtailment rate. Cooperation is at the maximum without any infrastructure limitations. Luxembourg (88 %), United Kingdom (87 %) and Serbia (100 %) cannot satisfy their hydrogen demand with their own hydrogen production and are not interconnected with neighbouring countries. Ireland with its high hydrogen production shows only 14 % hydrogen curtailment rate.
In Global ambition scenario, most of the countries show 60 % of hydrogen demand curtailment. Cooperation is at the maximum without any infrastructure limitations. Luxembourg (93 %), United Kingdom (90 %), Ireland (81 %) and Serbia (100 %) cannot satisfy their hydrogen demand with their own hydrogen production and are not interconnected with neighbouring countries.
H₂ Infrastructure Level 2
In National Trends scenario, all countries mitigate their demand curtailment. Most of the countries mitigate their demand curtailment to 5 %. Luxembourg shows 35 % demand curtailment and Belgium cannot cooperate more due to a bottleneck. United Kingdom and Ireland show 38 % demand curtailment due infrastructure limitation with Belgium.
In Distributed Energy scenario, most of the countries show 24 % demand curtailment. Bulgaria and Greece show 35 % demand curtailment and Romania cannot cooperate more with Bulgaria to mitigate demand curtailment in Bulgaria and Greece due to infrastructure limitations. Ireland with high hydrogen production shows only 16 % demand curtailment. United Kingdom shows 54 % demand curtailment and Belgium and Ireland cannot cooperate more with United Kingdom due to infrastructure limitations (bottlenecks).
In Global Ambition scenario, most of the countries show 40 % demand curtailment. Ireland and United Kingdom mitigate their demand curtailment to 52 % with additional hydrogen production using methane and interconnection with Belgium.
- 2050
H₂ Infrastructure Level 1
In Distributed Energy scenario, most of the countries show 50 % demand curtailment. Eastern countries (Hungary, Romania, Croatia, Greece and Slovakia) show 42 % demand curtailment and cannot cooperate more with other countries due to infrastructure limitations. Ireland shows only 8 % demand curtailment due to high hydrogen production. Portugal shows only 40 % demand curtailment due to high hydrogen production and cannot cooperate with Spain due to a bottleneck. United Kingdom (68 %), Luxembourg (90 %) and Serbia (100 %) are curtailed due to no interconnection with neighbouring countries and limited hydrogen production.
In Global Ambition scenario, most of the countries show 66 % demand curtailment. Hydrogen infrastructure does not show infrastructure limitation and cooperation is at the maximum between countries. Ireland (69 %), United Kingdom (79 %), Serbia (100 %) and Luxembourg (95 %) are curtailed due to lack of interconnection with other countries and with limited hydrogen production.
H₂ Infrastructure Level 2
In Distributed Energy scenario, demand curtailment is mitigated to 23 % – 24 % in most of the countries. United Kingdom shows 44 % demand curtailment and Belgium and Ireland cannot cooperate more due to infrastructure limitations.
In Global Ambition scenario, demand curtailment is mitigated to 31 % for most of the countries. United Kingdom and Ireland show 46 % demand curtailment and Belgium cannot cooperate more due to a bottleneck. Greece and Bulgaria show 35 % demand curtailment and Romania cannot cooperate more with them to mitigate their demand curtailment due to a bottleneck with Bulgaria.
7.4.2.2 Advanced and PCI Methane Infrastructure
Advanced and PCI methane infrastructure levels do not show any difference with existing infrastructure. Hydrogen infrastructure is limited in the use of methane to produce hydrogen and the Advanced or PCI infrastructure levels do not add any additional hydrogen production.