Picture courtesy of ASTORA
6 Supply Mixes
Underground natural gas storages are the most common and efficient way to store energy. These facilities are considered to be highly secure due to their underground location, below the earth’s surface in salt caverns or porous geological formations such as sedimentary rocks or aquifers, designed to prevent any leakage of stored gas.
During the summer months, when energy demand is low, the gas system is used to inject natural gas into underground storages to ensure security of supply.
In winter or for market reasons, the gas is extracted from underground storages and transported through the gas pipelines to meet heating demand of homes, buildings and businesses, and also to electricity generation plants like combined cycle gas turbines (CCGTs).
The gas stock should be carefully monitored to ensure that sufficient gas is available to meet demand at all times.
In the same way, future hydrogen storages can improve security of supply in Europe even more by providing a long-term solution with an efficient and clean energy source that helps to reduce the general EU dependence on imports.
6.1 Supply mixes under peak demand situations
Under high demand situations the supply and demand balance depends on a significant share of the methane underground gas storage utilisation while the overall need of methane supply imports decrease over the years.
The gas infrastructure for methane and the project based for hydrogen are both needed to enhance the security of gas supply in Europe in the different scenarios and years with enough new H2 import capacities and storages.
The following charts illustrate the evolution in the different scenarios.
Design Cases
- CH4 Supply Results for Peak Demand in Existing CH4 Infrastructure H2 Level 1
- CH4 Supply Results for Peak Demand in Advanced CH4 Infrastructure H2 Level 1
- CH4 Supply Results for Peak Demand in PCI CH4 Infrastructure H2 Level 1

Figure 6.1: CH4 Supply Results for Peak Demand in Existing CH4 Infrastructure H2 Level 1
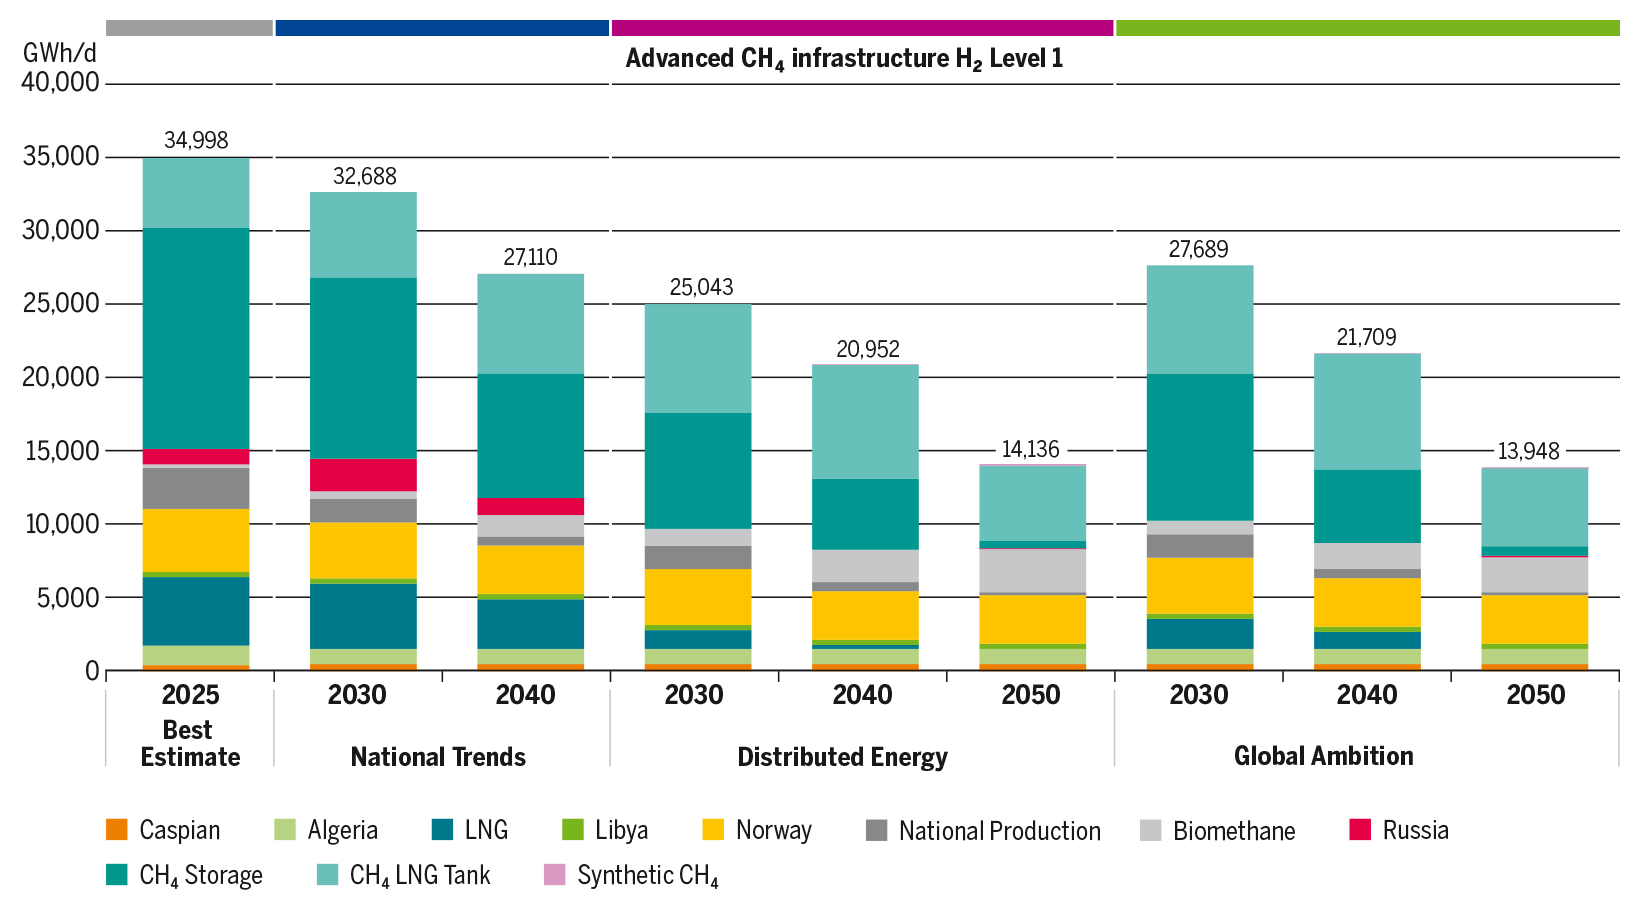
Figure 6.2: CH4 Supply Results for Peak Demand in Advanced CH4 Infrastructure H2 Level 1
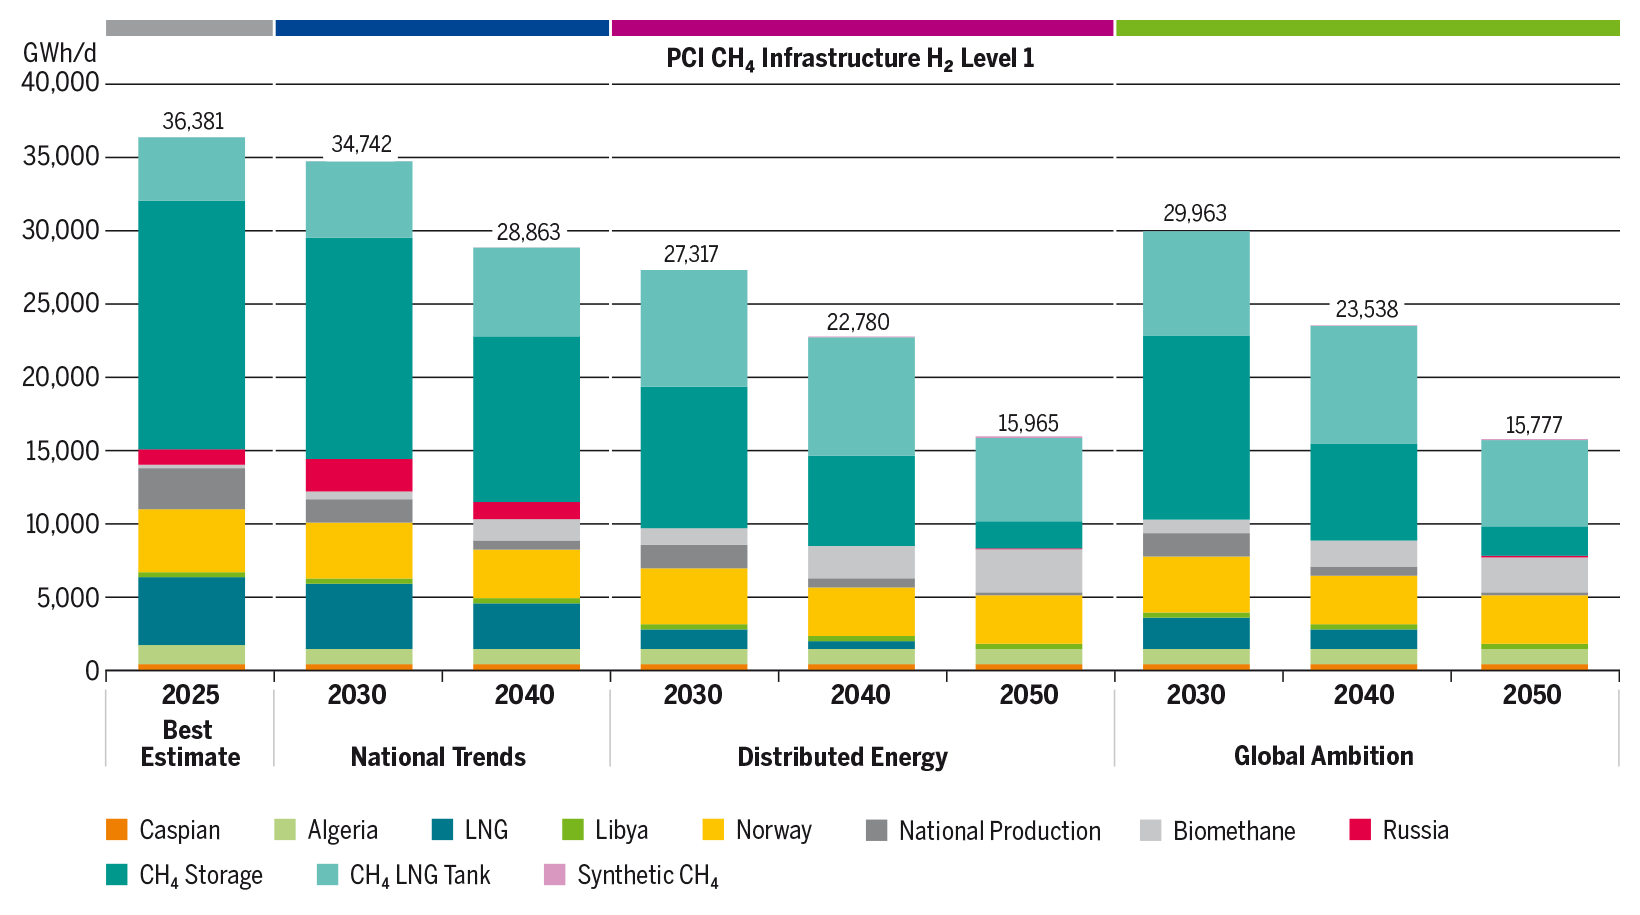
Figure 6.3: CH4 Supply Results for Peak Demand in PCI CH4 Infrastructure H2 Level 1
- H2 Supply Results for Peak Demand in Existing CH4 Infrastructure with H2 Level 1
- H2 Supply Results for Peak Demand in Advanced CH4 Infrastructure with H2 Level 1
- H2 Supply Results for Peak Demand in PCI CH4 Infrastructure with H2 Level 1
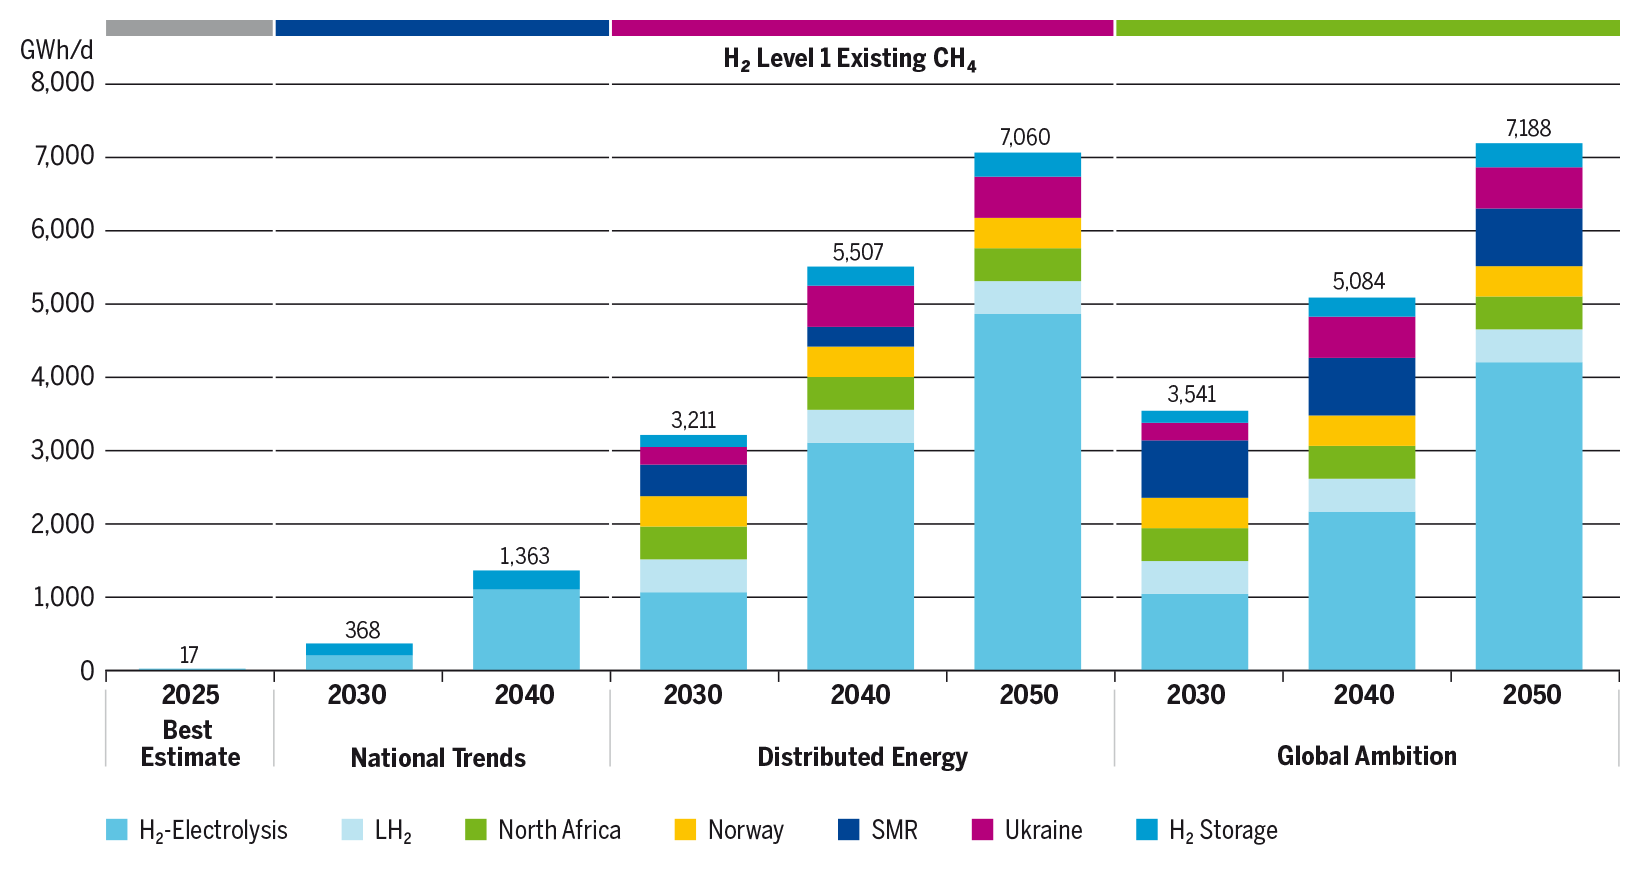
Figure 6.4: H2 Supply Results for Peak Demand in Existing CH4 Infrastructure with H2 Level 1
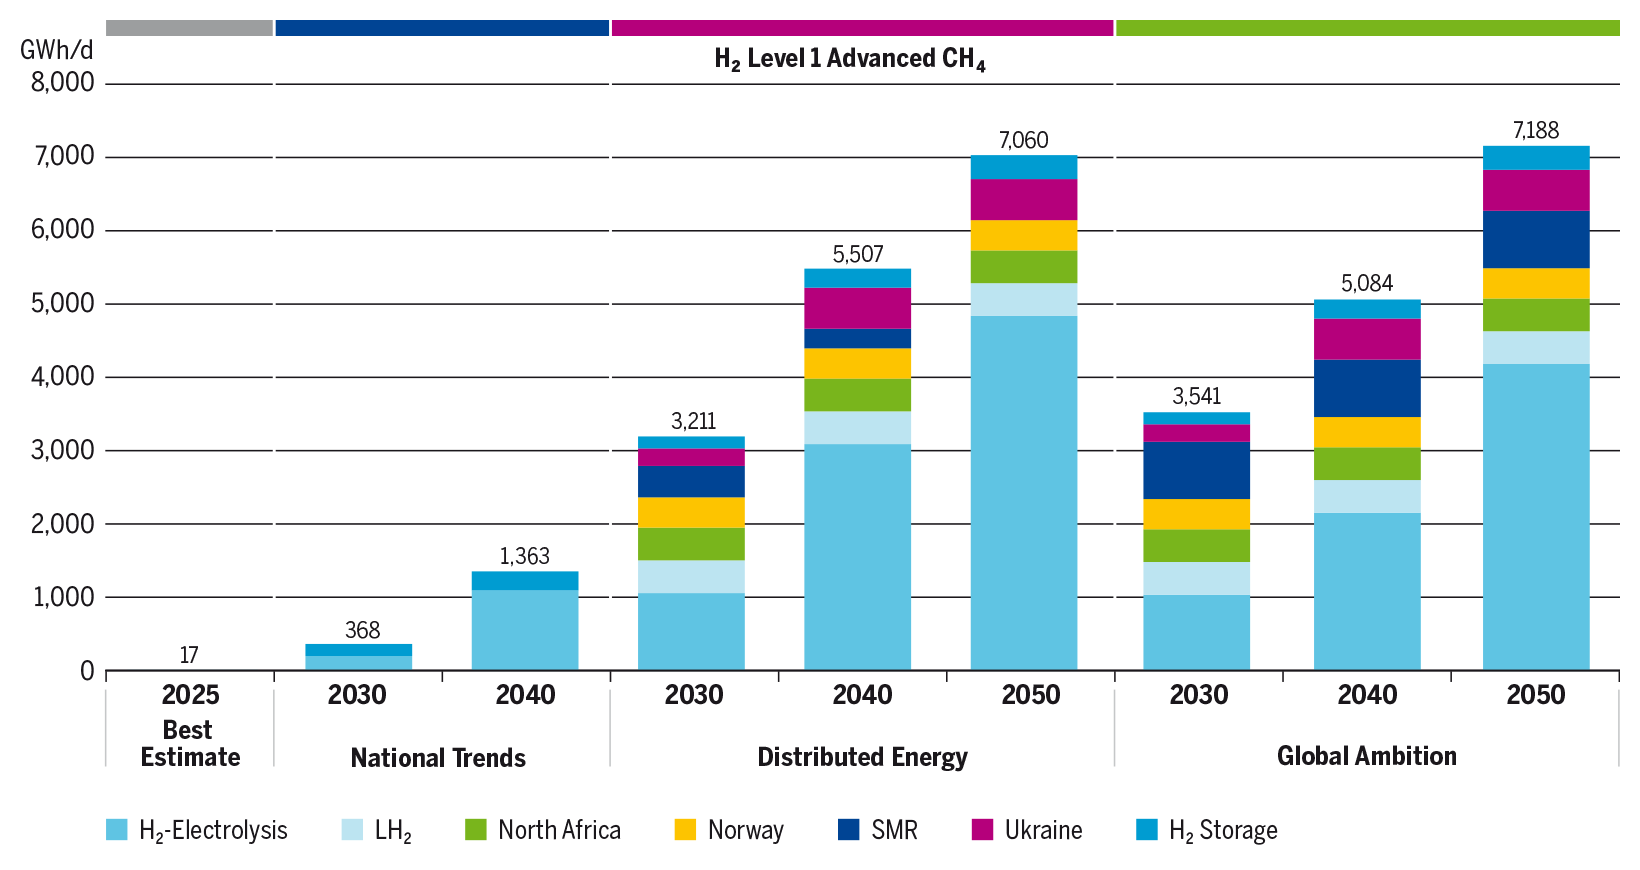
Figure 6.5: H2 Supply Results for Peak Demand in Advanced CH4 Infrastructure with H2 Level 1
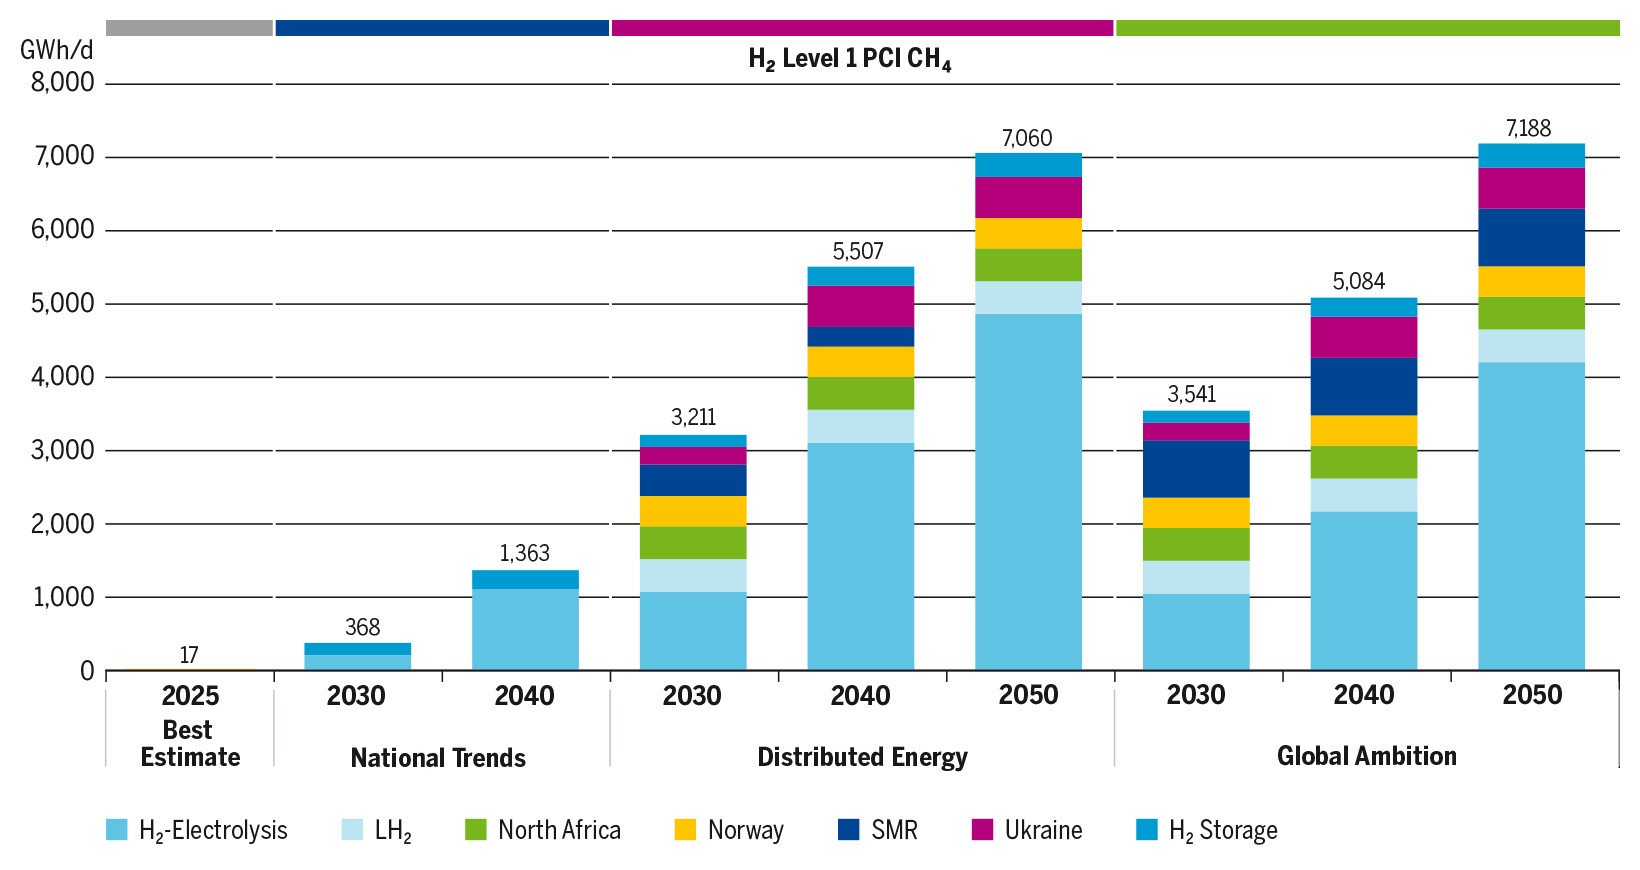
Figure 6.6: H2 Supply Results for Peak Demand in PCI CH4 Infrastructure with H2 Level 1
- H2 Supply Results for Peak Demand in Existing CH4 Infrastructure with H2 Level 2
- H2 Supply Results for Peak Demand in Advanced CH4 Infrastructure with H2 Level 2
- H2 Supply Results for Peak Demand in PCI CH4 Infrastructure with H2 Level 2
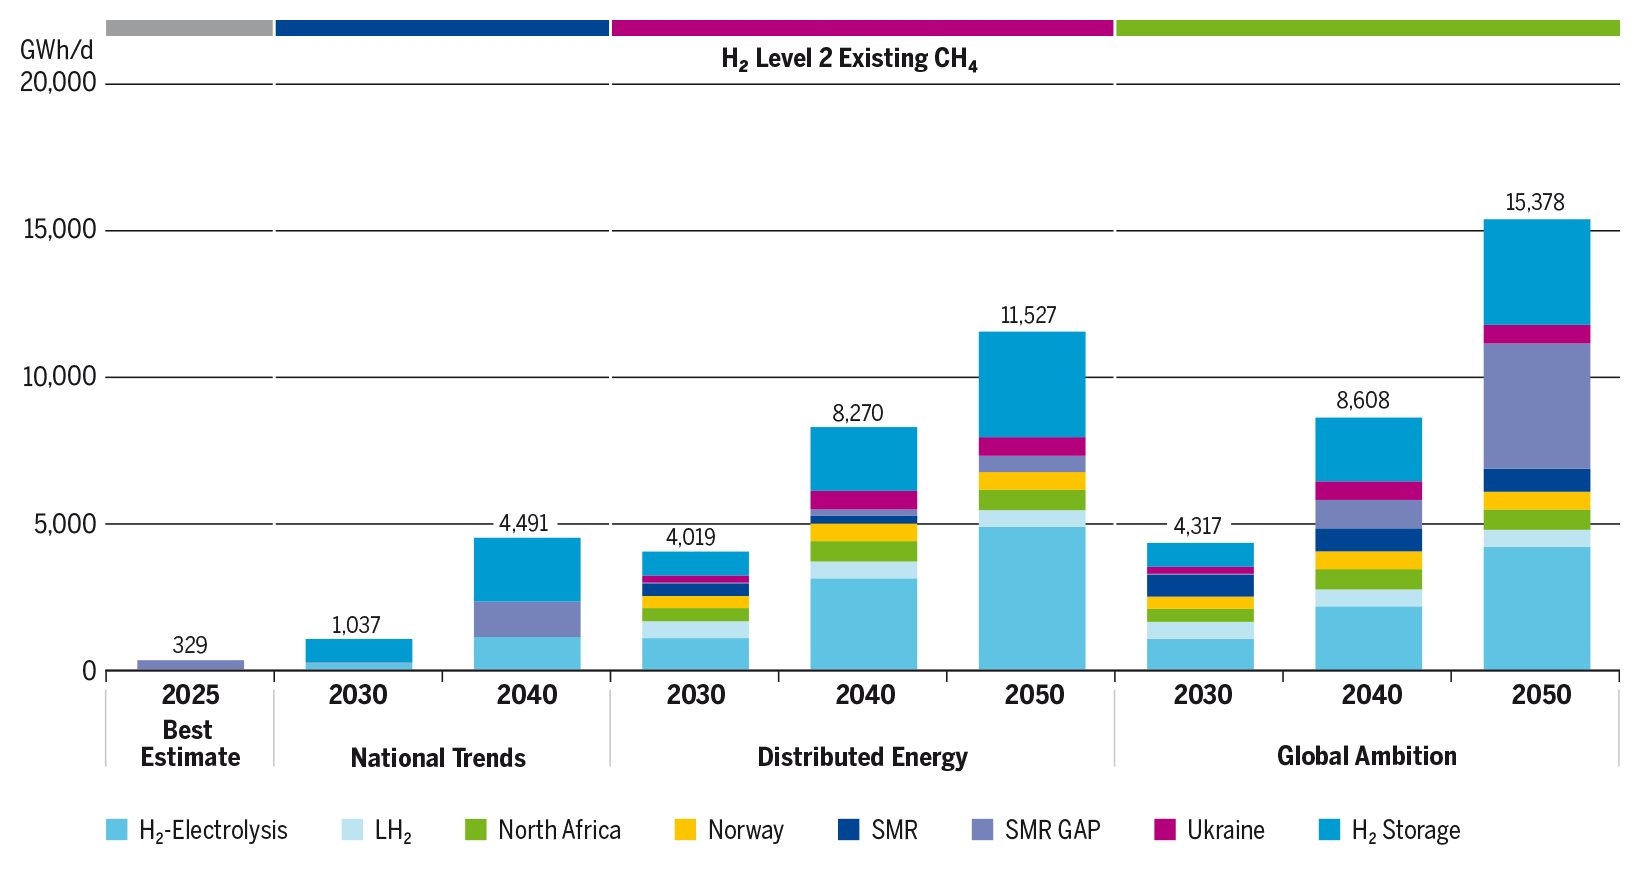
Figure 6.7: H2 Supply Results for Peak Demand in Existing CH4 Infrastructure with H2 Level 2
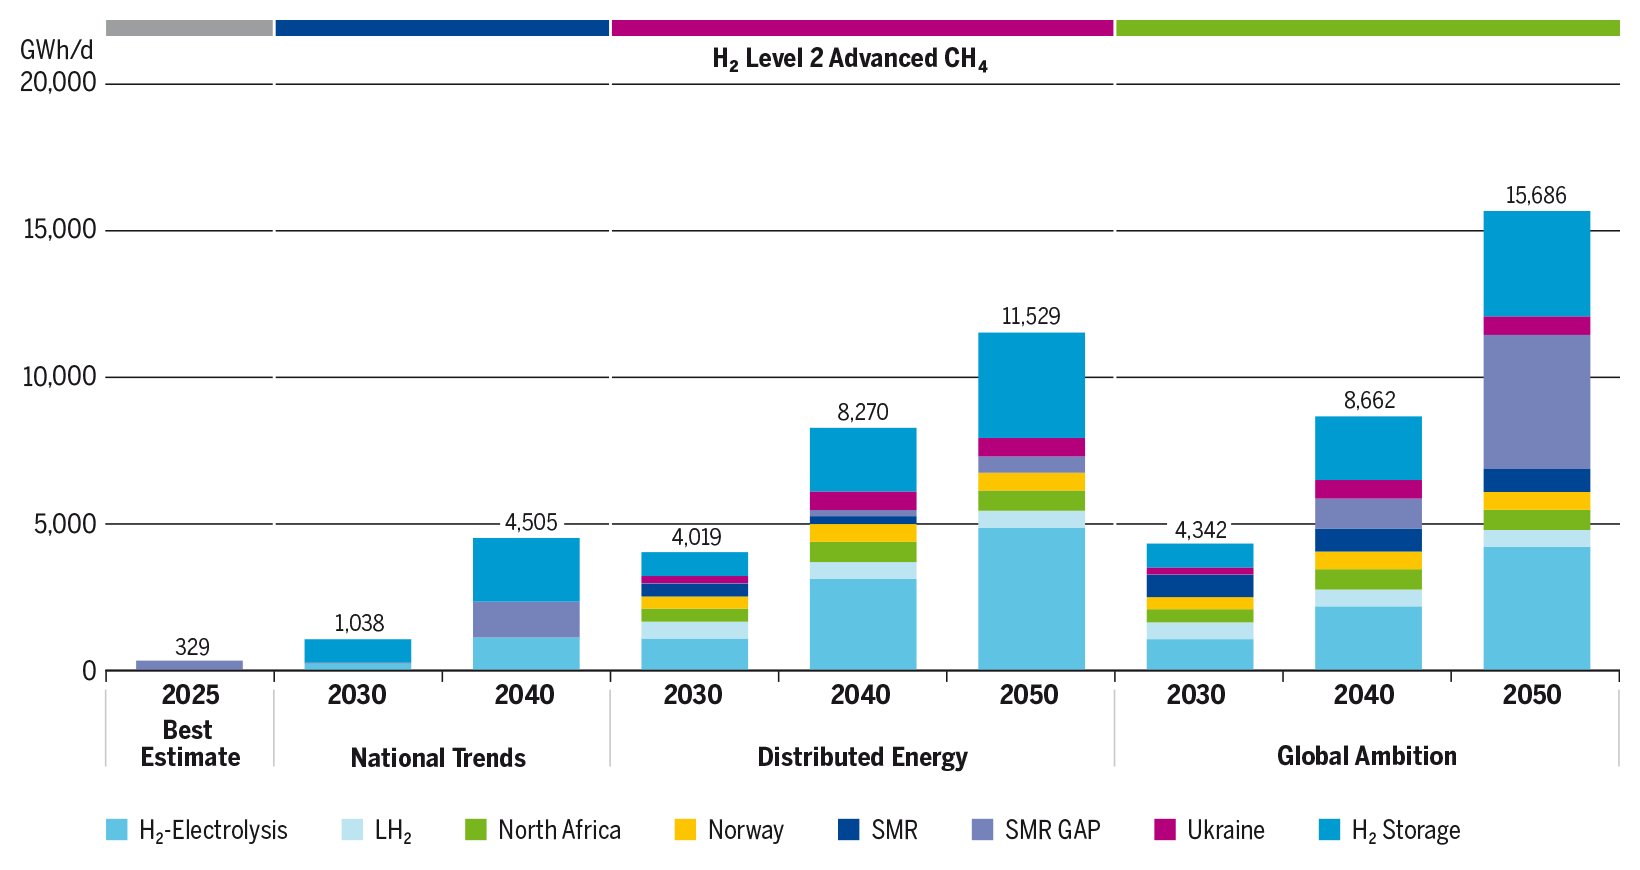
Figure 6.8: H2 Supply Results for Peak Demand in Advanced CH4 Infrastructure with H2 Level 2
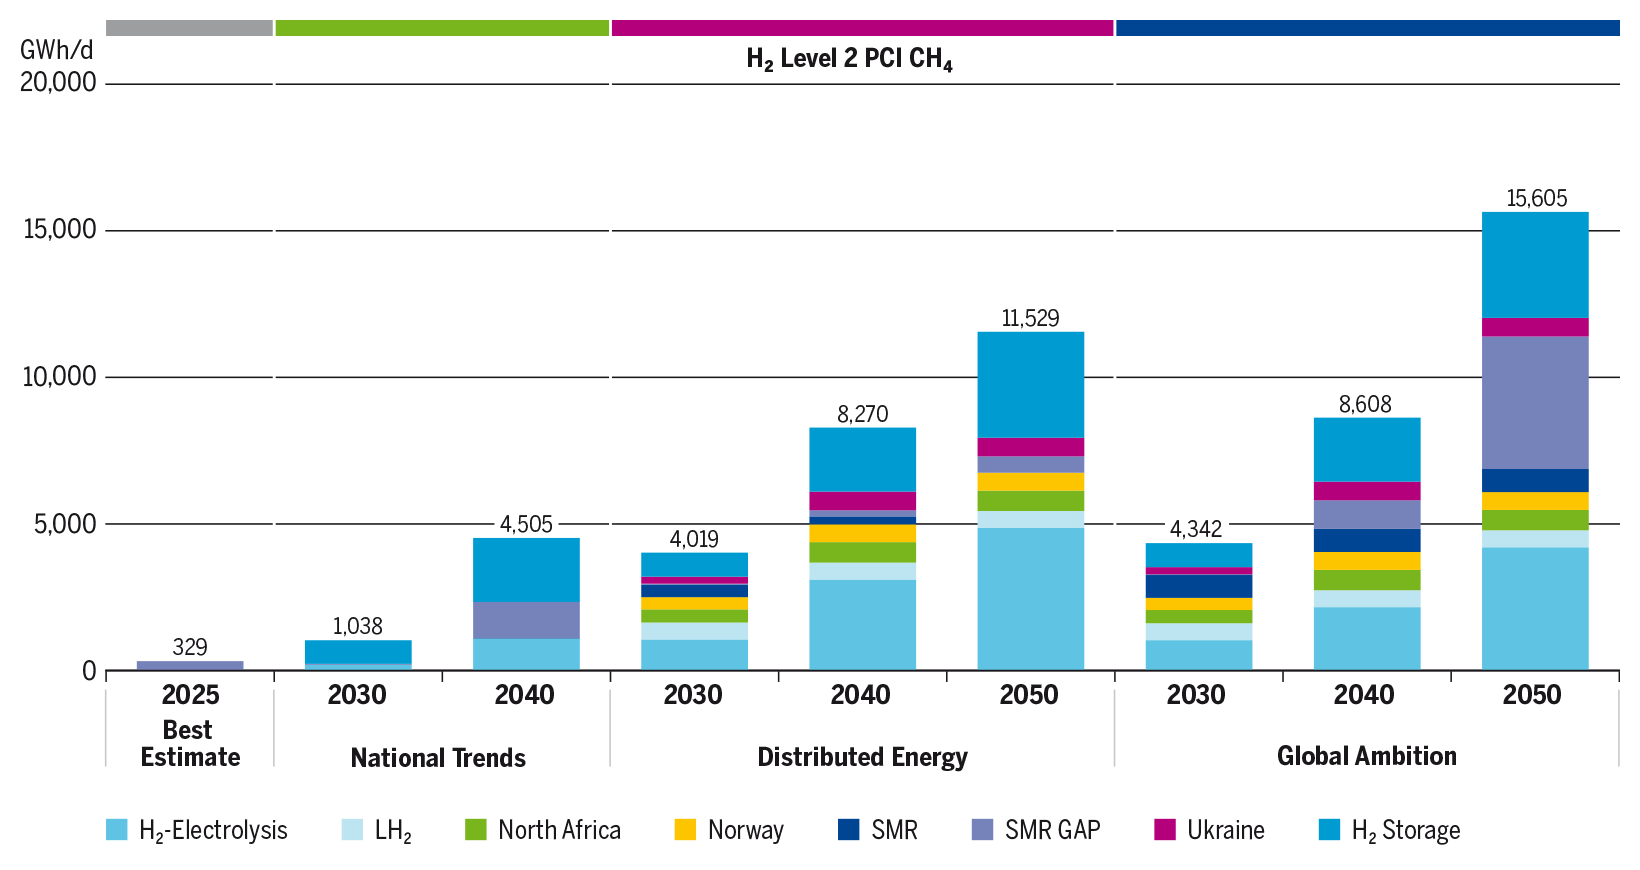
Figure 6.9: H2 Supply Results for Peak Demand in PCI CH4 Infrastructure with H2 Level 2
6.2 Supply mixes for Yearly demand
This analysis investigates the differences of the contrasted supply mixes in the European yearly supply and demand balance. This is achieved through supply configurations intended at minimising Russian gas.
Conventional natural gas production declines over the years and, even with the expected ramp-up of the biomethane production, the supply and demand balance relies on rather stable levels of import shares from Norway, LNG, North Africa and the Caspian.
Regarding hydrogen in Global Ambition and Distributed Energy, for any of the two infrastructure levels, there is a high expectation to reach already by 2030 a very ambitious national production basis together with several import sources (Norway, LH2, North Africa and Ukraine) all taking-off at the same time.
The evolution of the supply mixes share for the PCI and Advanced infrastructure level follow the same trend as for the Existing Methane Infrastructure level.
- CH4 Yearly Supply Results in Existing CH4 Infrastructure with H2 Level 1
- CH4 Yearly Supply Results in Advanced CH4 Infrastructure H2 Level 1
- CH4 Yearly Supply Results in PCI CH4 Infrastructure H2 Level 1
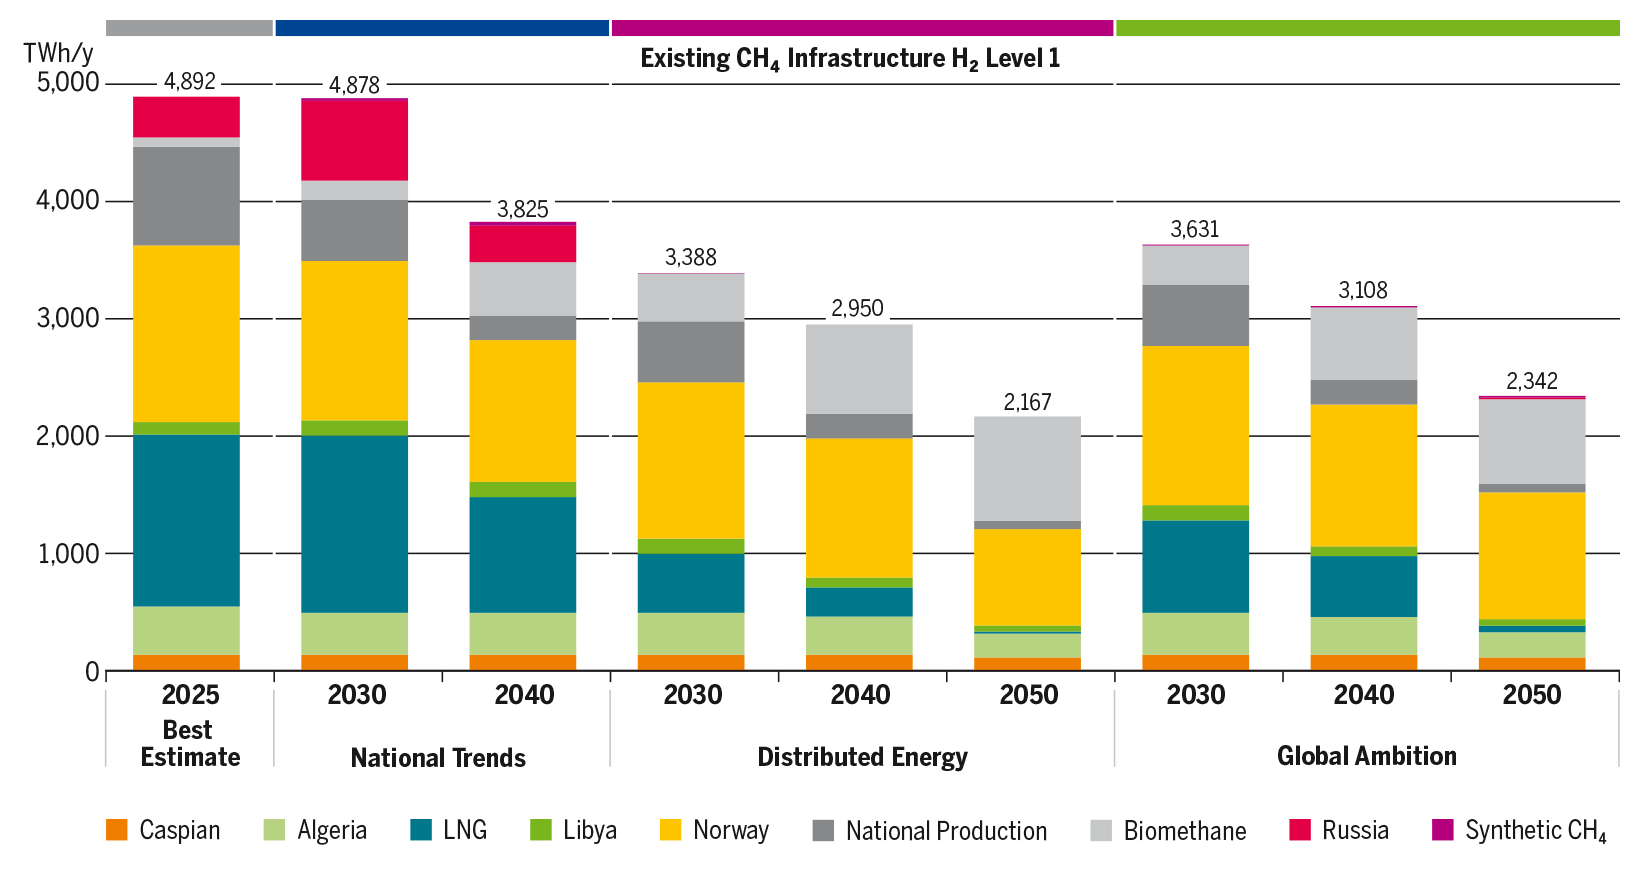
Figure 6.10: CH4 Yearly Supply Results in Existing CH4 Infrastructure with H2 Level 1
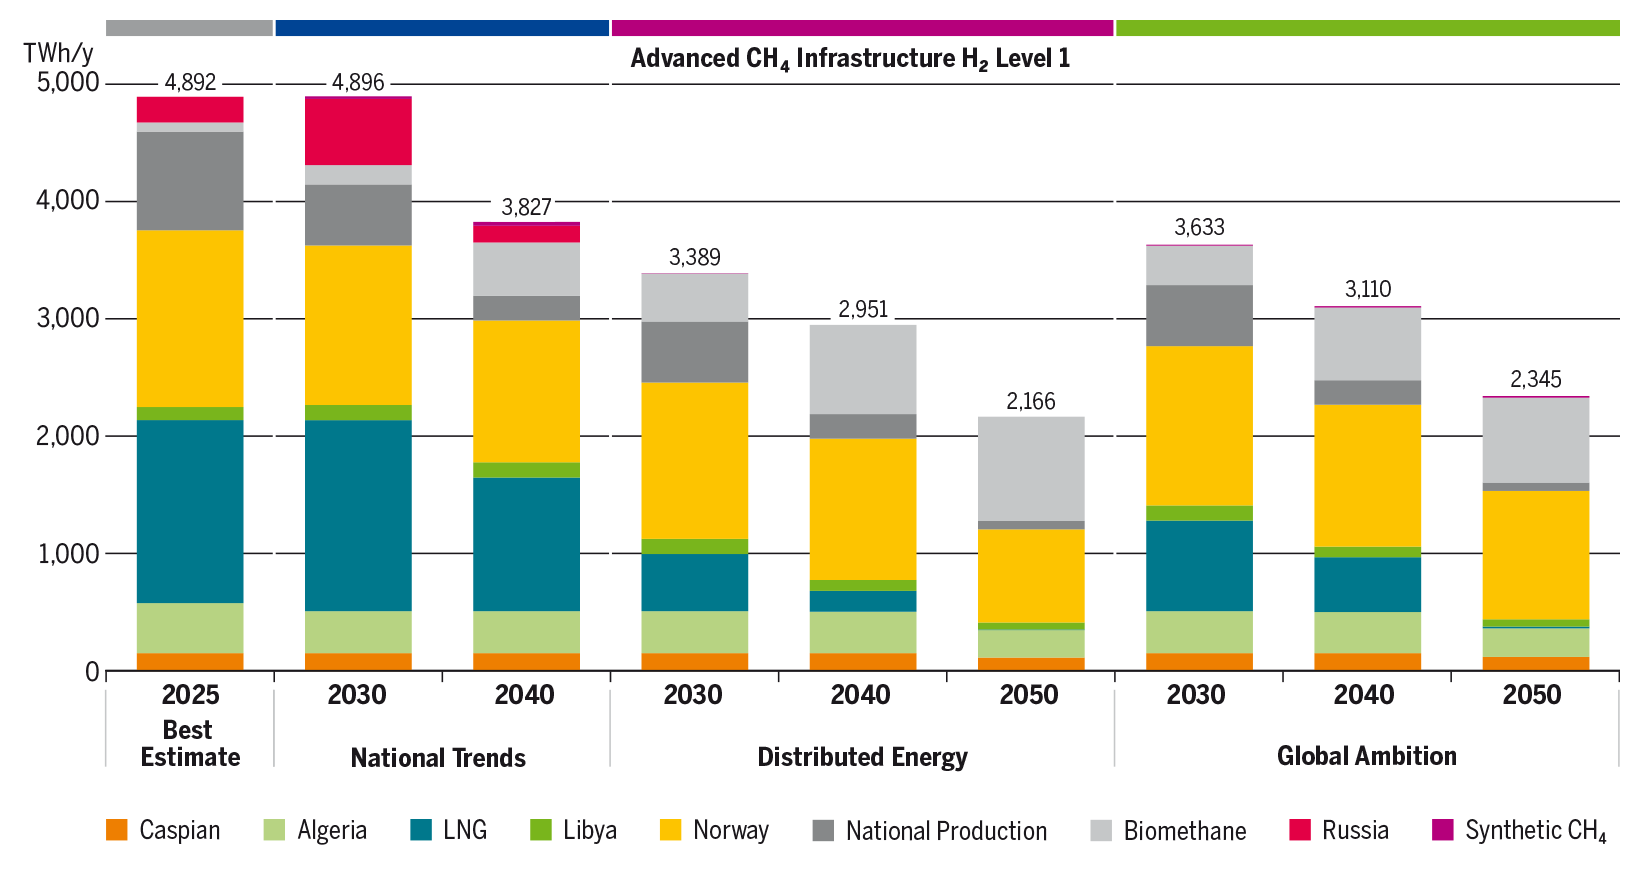
Figure 6.11: CH4 Yearly Supply Results in Advanced CH4 Infrastructure H2 Level 1

Figure 6.12: CH4 Yearly Supply Results in PCI CH4 Infrastructure H2 Level 1
- H2 Yearly Supply Results in Existing CH4 Infrastructure with H2 Level 1
- H2 Yearly Supply Results in Advanced CH4 Infrastructure with H2 Level 1
- H2 Yearly Supply Results in PCI CH4 Infrastructure with H2 Level 1

Figure 6.13: H2 Yearly Supply Results in Existing CH4 Infrastructure with H2 Level 1

Figure 6.14: H2 Yearly Supply Results in Advanced CH4 Infrastructure with H2 Level 1
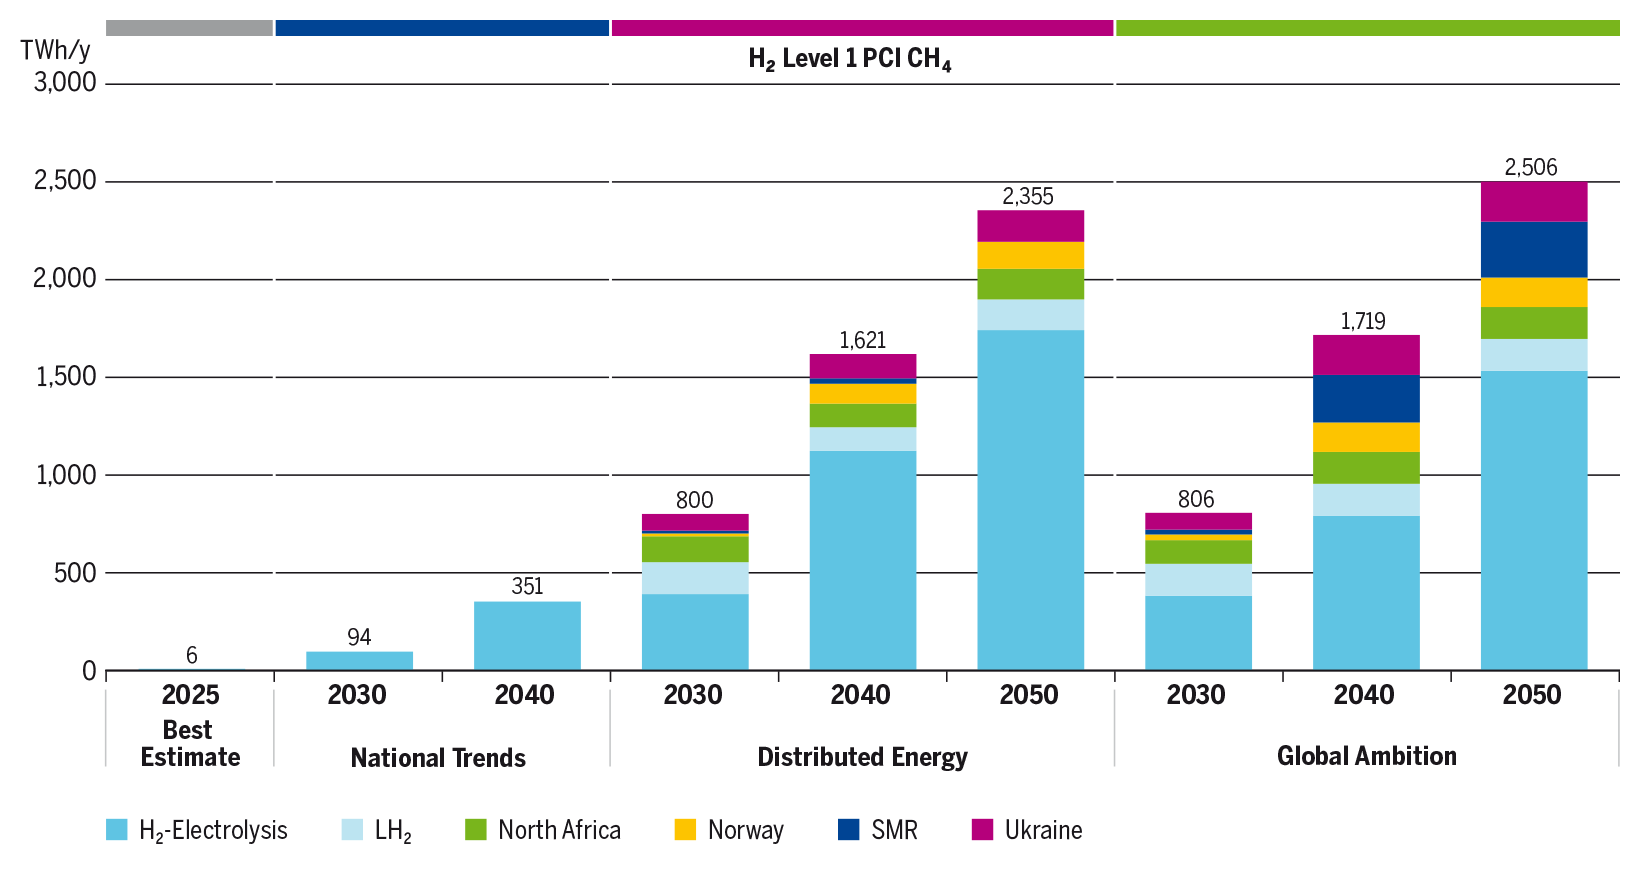
Figure 6.15: H2 Yearly Supply Results in PCI CH4 Infrastructure with H2 Level 1
- H2 Yearly Supply Results in Existing CH4 Infrastructure with H2 Level 2
- H2 Yearly Supply Results in Advanced CH4 Infrastructure with H2 Level 2
- H2 Yearly Supply Results in PCI CH4 Infrastructure with H2 Level 2

Figure 6.16: H2 Yearly Supply Results in Existing CH4 Infrastructure with H2 Level 2
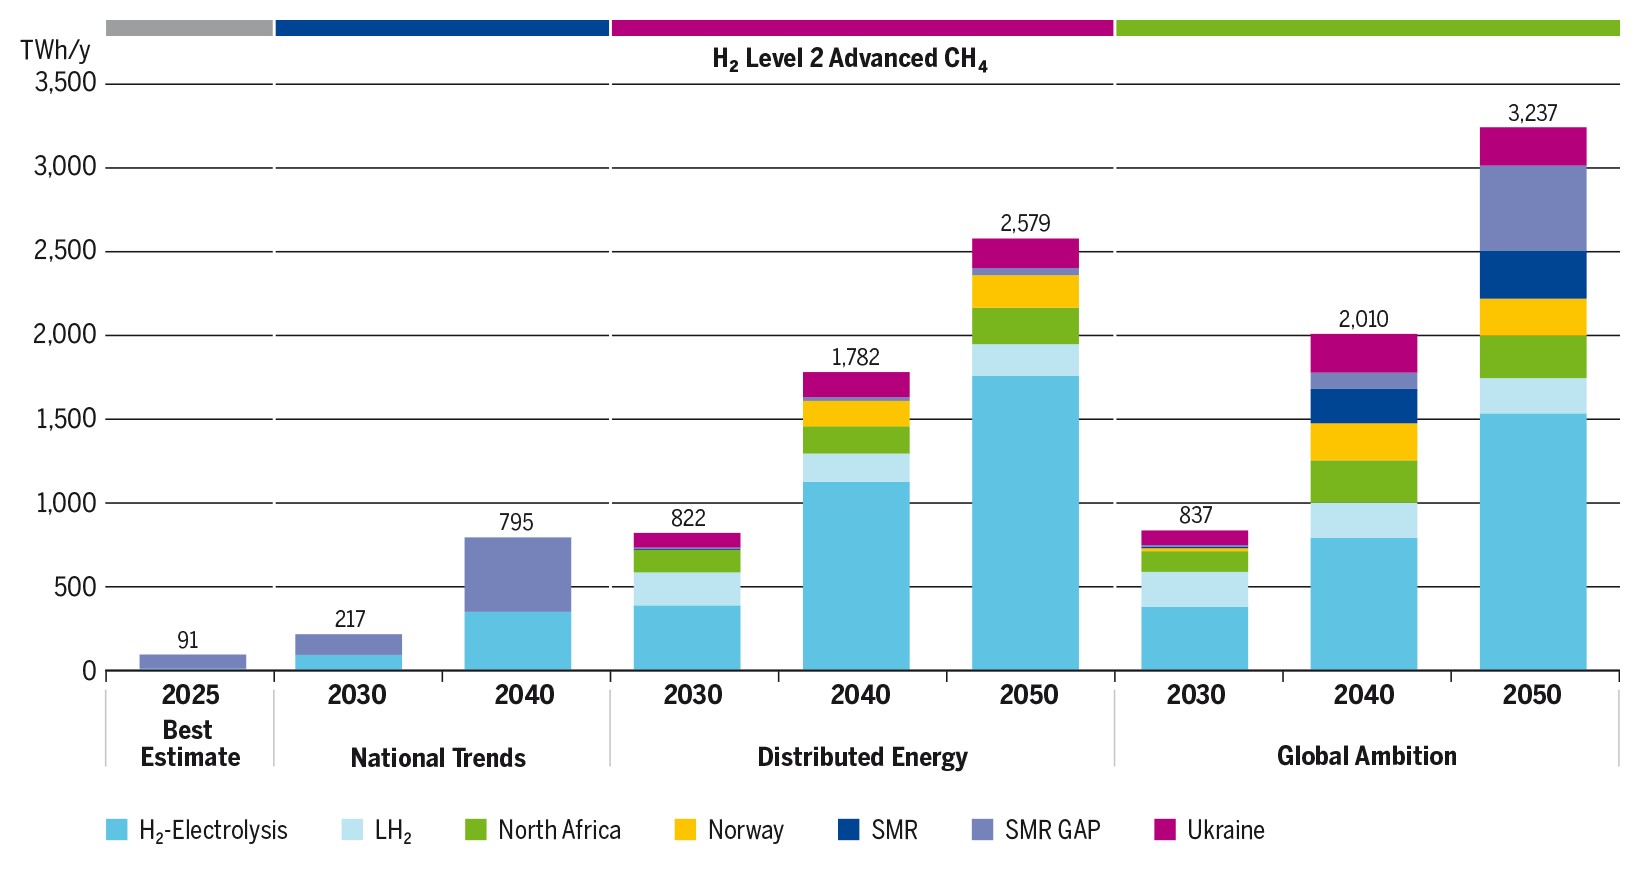
Figure 6.17: H2 Yearly Supply Results in Advanced CH4 Infrastructure with H2 Level 2

Figure 6.18: H2 Yearly Supply Results in PCI CH4 Infrastructure with H2 Level 2